Welcome to the HDX bandwidth testing blog series! In the following posts I’ll be sharing key findings and results from an extensive round of XenDesktop 5.6 / XenApp 6.5 bandwidth testing. Already using XenDesktop 7? Well then stay tuned for the last post in the series where I will be discussing that as well. Before I begin, I want to take this opportunity to thank Andy Baker and Thomas Berger for their tremendous help and guidance in managing this effort.
XenDesktop Bandwidth: The Complete Set
Part 1 – The Prologue: Methodology and Infrastructure
Part 2 – By The Numbers: Take the time to optimize
Part 3 – Bringing It All Together: Daily User Average and General Recommendations
Part 5 – Do It Yourself: Starter Kit
Part 7 – Who needs a part 6 when we’re discussing XenDesktop 7.x (And XenApp 7.5!)
Bonus Customer Analysis!
Bonus HDX 3D Pro!
Part 1: The Prologue
It is not uncommon these days to have great LAN networks with what seems like unlimited bandwidth. I find myself at the office running multiple virtual desktops, uploading my files to ShareFile, all while streaming Spotify to my machine at the same time without even noticing. Even at home you have a nice fast connection just for yourself. Unfortunately many users do not have this luxury due to expensive business grade connections which are often over utilized. Overlooking this fact during a deployment can result in frozen and disconnected sessions and an overall poor user experience. This leaves IT departments frequently asking “how much bandwidth do I need for XenDesktop?”
Of course the answer to this question – in my opinion more so than most questions – is it depends. Why is that? Because it depends on what is on the screen at any given time. The amount of bandwidth consumed will be close to none when the session is idle, but can vary greatly depending on whether a user is typing, browsing a document, running a slideshow, or watching a video. Of course there is always the magic number of 20-30kbps that has been around forever, but that was before the explosion in multimedia content both on the web and now seen more frequently in applications as well . (Although I would note that we did reach and beat that 20-30kbps zone with some of our less multimedia intensive tests).
To help better answer this question our team decided to start running some tests…..a lot of tests. We measured general daily usage, took a deep dive into single application tests, and put some optimizations and best practices to the test. In part one of this blog I will be discussing the infrastructure and methodology for our first round of testing.
Infrastructure
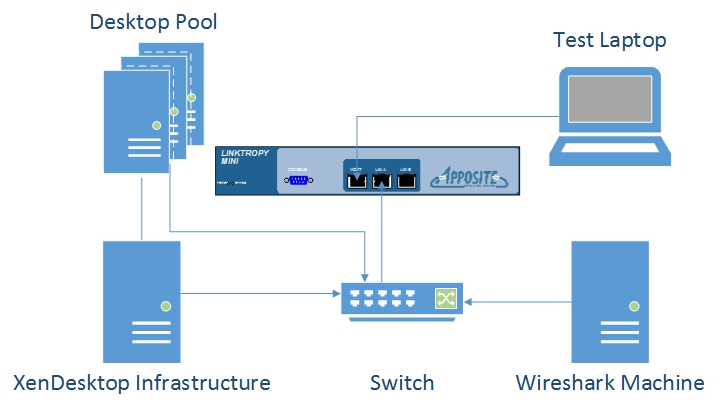
The tests that I will be discussing were run in the environment shown below. A laptop was connected to an Apposite WAN Emulator and used as the endpoint for both the manual and Login VSI tests. The emulator was used to control the bandwidth limits for each scenario that I describe later on in this blog post. The other end of the emulator was connected to a switch that was configured to send all packets in and out of the emulator to a mirrored port monitored by a server running Wireshark. This ensured all communication between the client and virtual desktop were captured without interfering with the VSI scripts. The environment infrastructure and desktop pool were also connected to the switch and communicated transparently to the laptop.
The environment was built using the product versions shown below. This is important to note as future tests are planned with XenDesktop 7 which benefits from newer codecs and algorithms for rendering. These tests were also run with the latest version of Login VSI which features more intense workloads than previous versions and a large randomized content library.
- XenServer 6.1
- Microsoft Server 2008 R2
- Windows 7 x86
- XenDesktop 5.6
- VDA 5.6.2
- Receiver 3.4 Enterprise
- Login VSI 4.0
Disclaimers
Before I begin to explain the tests that we ran I need to make a few disclaimers. The first being that quality of service (QoS) was not implemented in this environment. This decision was made as we wanted to look at the total ICA session consumption and decided that QoS would add another layer of complexity. In a production environment QoS can make a difference and we do recommend implementing it with proper testing.
The other limitation that we encountered was with Login VSI. The automated scripts run on the hosted infrastructure, not from the client machine. This means that the mouse and keyboard clicks were simulated locally and not sent over the wire. We understand that this does affect the results although the vast majority of traffic during the session originates from the virtual desktop. In the results I discuss in the following blog series, the bandwidth averages are only for the XenDesktop or XenApp host bandwidth delivered to the client.
Lastly, since CPU, memory, and disk can cause degradation in user experience I made sure that there was an adequate supply of all three in the tests so that any degradation would be a result of limited bandwidth. It is important to note that some of the changes and policies in reducing bandwidth can come at a cost of CPU and that each environment will have different requirements in this regard.
Login VSI Tests
This round of testing was completed using a single user on a set network capacity. The tests were run using Login VSI version 4.0. The application deep dive was run with 5 separate workloads corresponding to Microsoft Word, Excel, Outlook, PowerPoint and Adobe Reader. Each workload was created by removing all actions in the default VSI Medium workload except for those corresponding to the application of interest and will be available later in this blog series. The workloads did not include any pauses or breaks and therefore are intense use cases and not a “daily user average”. The goal of these tests was to focus on how the different applications react to a WAN network and how low we could push them with the right optimizations in place. These workloads were run at 6 different bandwidth limits with 3 separate configurations. The breakdown of the tests are shown below.
- Applications
- Microsoft Word 2010
- Microsoft Excel 2010
- Microsoft Outlook 2010
- Microsoft PowerPoint 2010
- Adobe Reader XI
- Bandwidth Caps
- LAN (1 Gbps)
- 2.048 Mbps
- 1.536 Mbps
- 1.024 Mbps
- 512 kbps
- 256 kbps
- Configurations
- Default
- Optimized
- Max Optimized
5 Applications X 6 Bandwidth Caps X 3 Configurations X 5 Tests for consistency = 450 Tests
But How Much Bandwidth?
Now because the Login VSI Medium workload is seen by many as a standard, I ran additional tests at each configuration to come up with a sort of “daily average”. Not to be confused with the application deep dive of the 450 tests above, I will share the results of this daily average later in the series to bring everything together and summarize recommendations learned from this experience. This average includes the applications above as well as internet browsing, image viewing, 480p video, and idle time. You can find the official workload here.
Manual Tests
Each scenario was also tested manually to get a feel of the responsiveness and quality of the session. I did this by performing specific tasks using each application and rating the responsiveness of each task. For example, using the default image at 1.536 Mbps, scrolling through slides in PowerPoint was “Good”, while playing a slideshow with images and transition animations was deemed “Average” due to a slight delay.
Bandwidth Limits
As I mentioned earlier, every test was run at 6 different bandwidth limits. After much discussion we had agreed on the 5 limits as well as LAN speed for baseline. These limits allowed us to better understand when certain actions begin to be affected through manual testing and then compare the bandwidth consumption and packets being delivered during the VSI workloads. For example, we were also able to see the improvements in responsiveness through optimization as more actions were rated “Good” at lower bandwidth limits when heavier optimizations were applied, such as Excel pictured below at a 256kbps network limit.
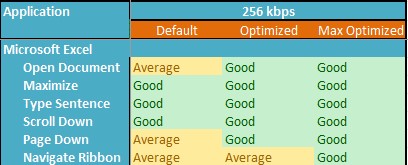
Each application at each bandwidth cap was rated and anything below “Good” was commented on. In the case above, paging down the excel sheet at default configuration was rated “Average” due to a slight delay in the text appearing. This was a sheet that was fully prepopulated with text and some cells highlighted. An empty sheet or one with minimal text performed very well in manual tests at our lowest limits. In the case of the ribbon in Excel 2010, there was a slight delay the first time I navigated to another tab, but once that tab had been cached I could browse the tabs as if the application were running locally.
Metrics
To examine the tests runs and compare them to one another we used a variety of metrics which I will explain below. In terms of bandwidth, Wireshark captured every packet in the ICA session so we decided to look at the following:
- Average bandwidth
- Total amount of data transferred
- Number of packets transferred
- The peak bandwidth hit during the session
We also wanted a way to try and measure the user experience in some way other than manual testing which has an inherent element of subjectivity to it. To do this we borrowed a tool from engineering to help us capture two additional metrics for each session:
- Frames per second transmitted to the client (FPS)
- ICA round trip time (ICART)
You can read more on using these counters in Frank Anderson’s User Experience Blog. Since you have already seen that we did in fact use manual testing, it may not surprise you to hear that there were some limitations to using these two metrics in our specific testing.
As Frank mentions in his blog, when the network capacity is reached, ICART begins to increase due to the added latency. We did in fact see this happen as expected, however the ICART peaks measured in the different test runs varied too widely to use ICART as a reliable basis for our rating. Instead we looked at the trends between both different configurations and different bandwidth limits as an overall measure of responsiveness which I will reveal in the next part of this series.
FPS also proved to have its limitations, especially in the optimized configurations. As you will find out next time, part of our optimized configurations included limiting the FPS using Citrix policies. This will of course lower the FPS that we measure and proved a better metric for comparison during our “Default” tests.
Next Time
So what did we find with so many tests? Well for starters, spending just a couple of hours optimizing visual settings can provide huge bandwidth savings and improve the responsiveness of the session and overall user experience. In part 2, I will discuss the difference between the optimized and non optimized tests as well as the optimizations that we applied.
Thank You
I would like to thank Marcel Calef, Derek Thorslund, Frank Anderson and Mohit Oza for their input and expertise in making this testing possible.
Thanks For Reading,
Amit Ben-Chanoch
Worldwide Consulting
Desktop & Apps Team
Project Accelerator
Virtual Desktop Handbook
Follow @CTXConsulting