Last year I published a series of blogs around the bandwidth requirements of XenDesktop and some of the optimizations that can be done to minimize those requirements and improve the overall user experience. The final blog explored XenDesktop 7.x and the new encoding methods which are now a key design decision in dictating the bandwidth requirements and user experience.
I recently had the opportunity to perform some bandwidth analysis at a customer who has allowed me to share the results while staying anonymous and am happy to say that the results were even better than I expected! Below I will share a little bit about the environment and the results of the analysis.
Customer Environment
The analysis was done during a production pilot migrating users to XenDesktop 7.1 on Server 2012. The Hosted Shared Desktops were delivered from the main datacenter through NetScaler Gateway to the remote site. A simple diagram is shown below. (High availability as this is productionJ!)
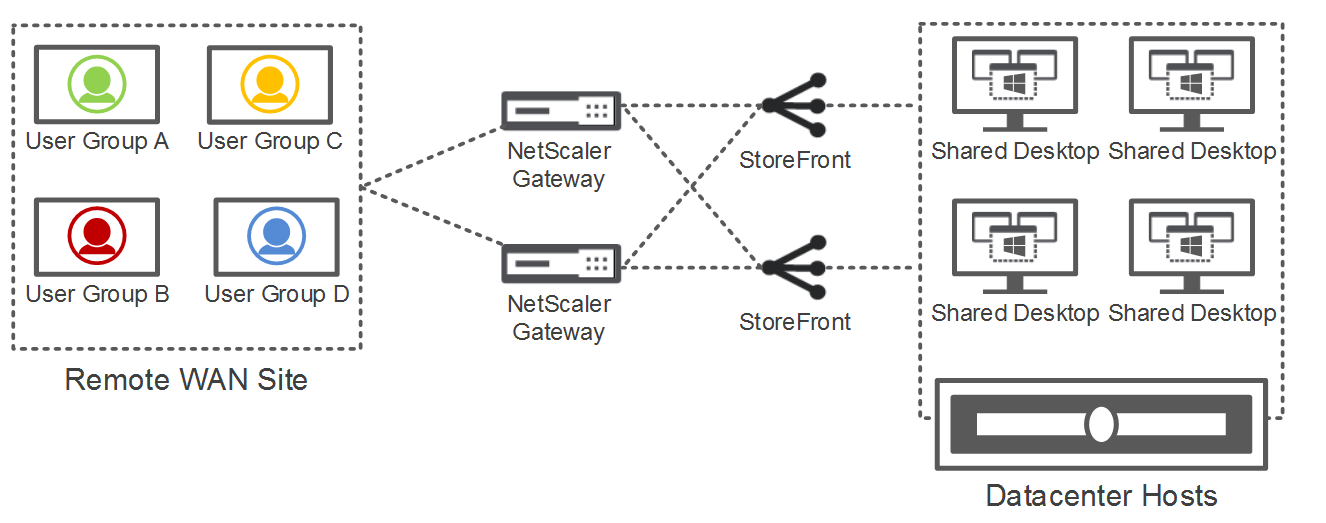
The connection between the two sites was a 20Mbps WAN with latency averaging just over 50ms. All end points used to access the desktops were managed thin clients which were running Receiver for Windows 3.4, the minimum version to support H.264 decoding on the end point. Roughly half of the pilot users in the analysis used XenDesktop with a dual monitor workstation as their main point of work.
Policies
A baseline WAN policy was applied to the desktops disabling the unnecessary visual effects and reducing the frames per second (FPS) target to 15. These desktops also leveraged a Start Menu replacement known as Classic Shell, which stored its visual effects setting separately and were disabled with the help of the online documentation.
Analysis
Throughout a two week period, the production pilot bandwidth was captured using the customers’ existing network monitoring solution Netflow Analyzer. The data was then analyzed daily during business hours (9AM to 5PM) in order to understand the bandwidth usage.
The following assumptions were made in calculating the average bandwidth:
- Users are active throughout business hours
- Connections with very little traffic were left out as to not skew the results as well as connections of the Citrix team and administrators
Based on those assumptions, the average bandwidth required came out at 100kbps per user during the pilot period. The top user session each day was also analyzed and averaged around 200kbps. This top user was always a member of one of the user groups which required dual monitors and which used their virtual desktop as their main workstation..
Update
Based on these results, I’ve refined my original formula for estimating bandwidth requirements. Taking into account these results and additional projects I have been working on, I present you with a formula that I believe is more representative of the bandwidth requirements and lucky for me, is lower than before J. You can find more on this in the latest release of the Virtual Desktop Handbook as well.
Bandwidth (kbps) = 200H + 100D + 1500X + Z
Where:
H = Number of concurrent users requiring video without flash redirection
D = Number of concurrent users who are not watching video
X = Number of concurrent users who require 3D applications (3D apps are especially difficult to estimate)
Z = Additional 1000 to 2000 kbps minimum capacity to support peaks in smaller environments (<10 users)
Note: This formula is based on a combination of LoginVSI 4.0 testing, manual user experience testing, and customer bandwidth analysis. It is not meant as a substitute for proper testing.
If you happen to be going to Synergy 2014, you can find out more about reducing your bandwidth requirements and implementing scalability optimizations by joining me at SYN311: Optimizing server scalability and reducing bandwidth requirements for XenDesktop/XenApp with my co-presenter Roger LaMarca!
Thanks for reading,
Amit Ben-Chanoch
Worldwide Consulting
Desktop & Apps Team
Project Accelerator
Virtual Desktop Handbook
Follow @CTXConsulting