With the introduction of RAM cache with overflow to hard disk (introduced in PVS 7.1, hotfix required), IOPS can be almost eliminated and has therefore become the new leading practice. However, this feature can have a significant impact the write cache sizing. This stems from the difference in how the write cache storage is allocated with this new option. To understand this feature and how to properly design your solution with it, Citrix Worldwide Consulting organized a series of tests, the results of which are shared in this post. I would also like to recognize my co-authors Martin Zugec, Jeff PinterParsons, and Brittany Kemp as this wasn’t a one-man job :).
Before we begin let me just note the scope of the article. We will not be covering any IOPS information as that has already very well covered in previous blogs. If you have not already, we recommend you read up on the blogs by Miguel Contreras and Dan Allen.
Turbo Charging your IOPS with the new PVS Cache in RAM with Disk Overflow Feature! – Part One
Turbo Charging your IOPS with the new PVS Cache in RAM with Disk Overflow Feature! – Part Two.
What is covered however is why sizing the write cache may change, what to do about it, and a deep dive as to how it works. This was all tested in the lab and we would like to thank the Citrix Solutions Lab team for providing the hardware and support that helped make this possible. The test environment and methodology is summarized at the end of the blog.
Lessons Learned
Out of all this testing there were some previous recommendations that were reinforced and new ones based on the additional findings. Based on the results of the testing, Citrix Worldwide Consulting propose the following recommendations for the new RAM cache with overflow to hard disk option.
- If transitioning an environment from Cache on HDD to Cache in RAM with overflow to disk and the RAM buffer is not increased from the 64MB default setting, allocate twice as much space to the write cache as a rule of thumb. Remember this storage does not need to be on a SAN, but can be cheaper local storage.
- The size of the RAM buffer greatly impacts the size of the write cache as any data that can be stored in the RAM buffer will not consume any space on the write cache. Therefore it is recommended to allocate more than the default 64MB RAM buffer. Not only will an increased RAM buffer reduce the IOPS requirements (see blogs mentioned above), but the write cache size requirements will be reduced as well. A larger RAM buffer may alleviate the larger write cache requirement for environments that do not have storage capacity. With enough RAM you can even eliminate the need for ever writing to the storage. For desktop operating systems start with 256-512MB and for server operating systems start with 2-4GB.
- Defragment the vDisk before deploying the image and after major changes. Defragmenting the vDisk resulted in write cache savings of up to 30% or more during testing. This will impact any of you who use versioning as defragmenting a versioned vDisk is not recommended. Defragmenting a versioned vDisk will create excessively large versioned disks (.AVHD files). Run defragmentation after merging the vDisk versions.Note: Defragment the vDisk by mounting the .VHD on the PVS server and running a manual defragmentation on it. This allows for a more robust defragmentation as the OS is not loaded. An additional 15% reduction in the write cache size was seen with this approach over standard defragmentation.
The rest of this post is a deep dive as to how the RAM Cache Overflow feature works and test results all of which back up the recommendations above. Also detailed out is the test methodology and the environment used for the testing which can help if you plan to perform additional testing in your environment.
RAM Cache Write Cache Sizing vs Cache in HDD
As mentioned above, the write cache with the new RAM cache overflow option can grow much larger and much faster than the previously recommended cache on device HDD option if not designed properly. Where the old option writes the data to the write cache in 4KB clusters, the new option now reserves 2MB blocks on the write cache which are composed of 4KB clusters.
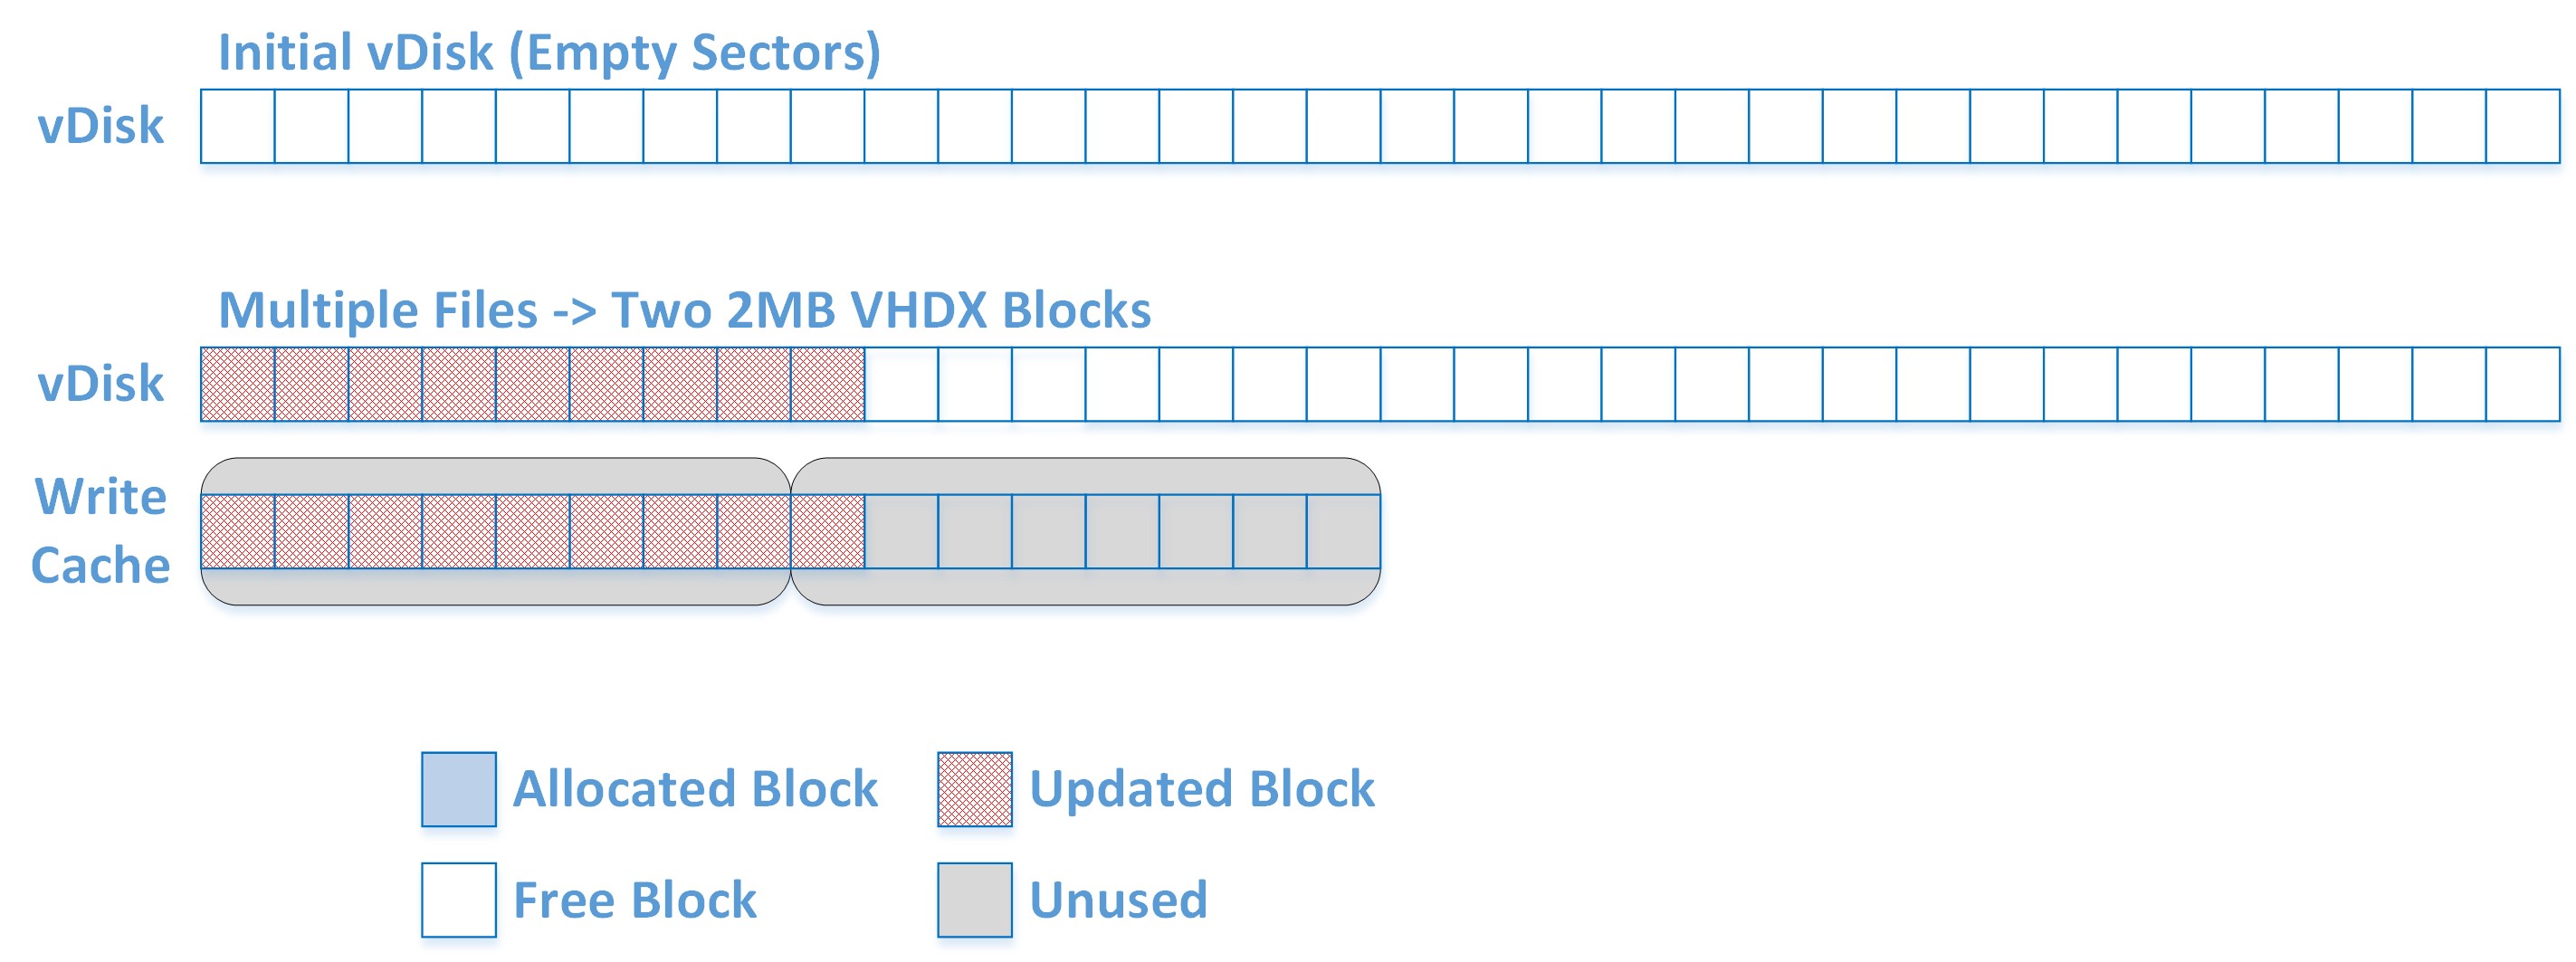
To illustrate the difference, reference the visual below. Note that although in the write cache a 2MB block is composed of 512 clusters (4KB * 512 = 2MB), for the sake of simplicity let’s assume each block consists of 8 clusters.
When the target device boots up, the OS is not aware of the write cache and writes to the logical disk that it is presented (the vDisk). By default, the Windows OS sets the file system to use 4KB clusters and therefore writes data into 4KB clusters.
The PVS driver then redirects this data at the block level to the write cache. Assuming we start with an empty area of the vDisk and we write multiple files which equal to just over 2MB of data. The OS writes the files onto consecutive clusters on the vDisk which are redirected to the write cache and completely utilize a 2MB block, but also reserve an additional 2MB block which is underutilized.
Since the OS sees these sectors as empty, the blocks can be written to and then further utilized if additional data is written by the target device.
To test this behavior we ran a series of tests on both the RAM cache with overflow option as well as the cache on device HDD for comparison.
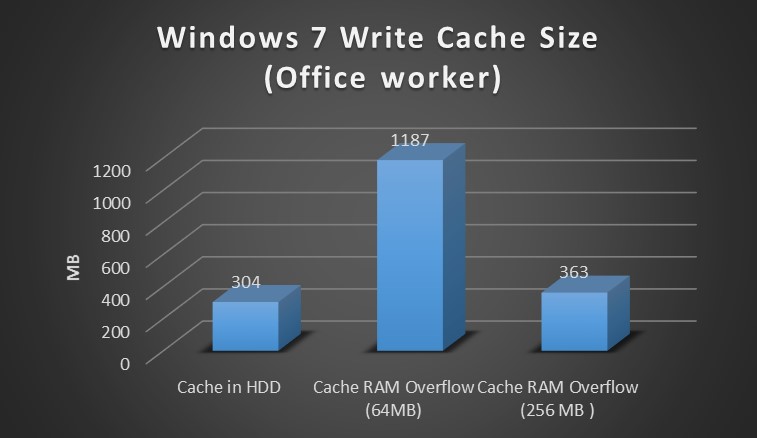
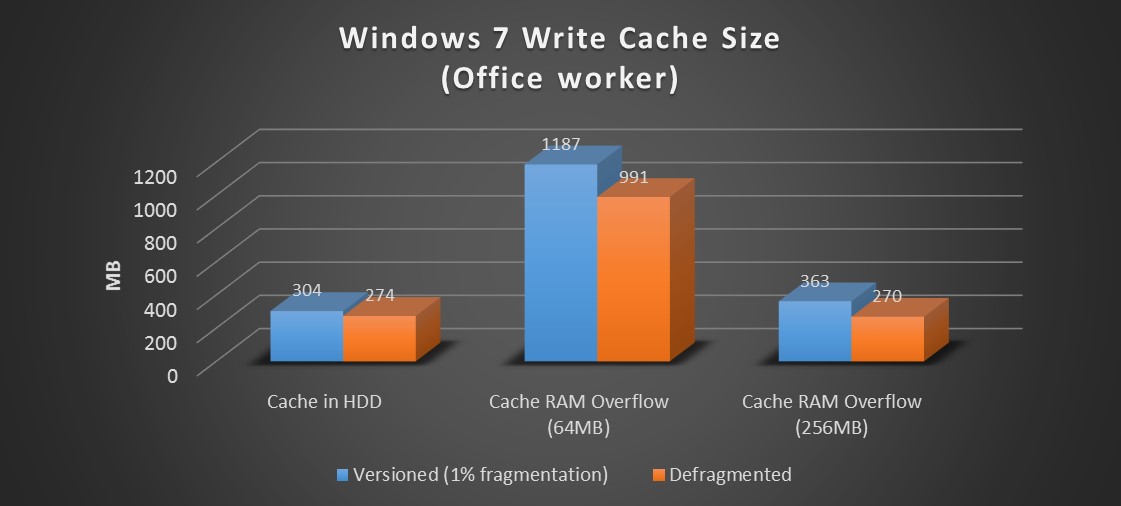
Below is a comparison of an office worker test run on a Windows 7 target device. We can see from the data the following:
- The RAM Cache option uses significantly more space on the write cache drive than the cache on device HDD. The reason for this is explained in the next section.
- The RAM Cache option is heavily impacted by the size of the RAM buffer. This is expected since much of the data does not get flushed to the disk as it remains in memory.
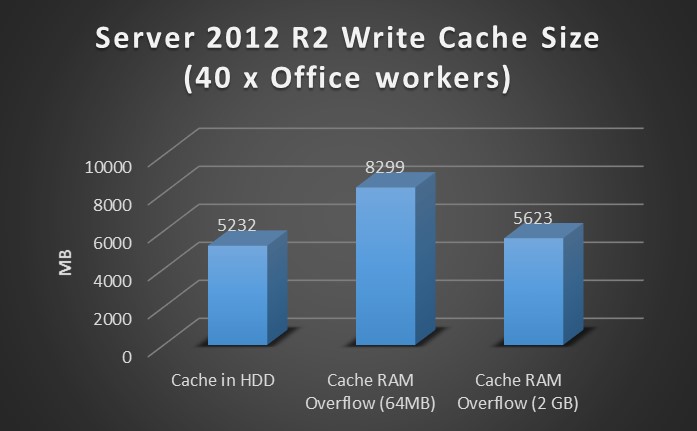
Running a similar test on Server 2012 R2 with 40 users, the same results are seen. Again the RAM Cache Overflow option with the default RAM buffer requires considerably more space than the Cache in HDD and is again greatly reduced by increasing to the RAM buffer.
To further investigate the effects, we decided to run specific tests to characterize the behavior of the write cache. We created 1,000 files on the target device each 1MB in size. This should translate into 1000MB of data being written to the write cache. As can be seen below, this was the case for the cache in HDD option, but using the RAM Cache Overflow option the result was doubled. We see a slight savings with an increased RAM buffer, but the savings is simply the additional files that have been cached in memory. Keep reading if you would like to know why we see this behavior and how to minimize the effect.

Effects of Fragmentation on Write Cache Size
The culprit above in excessive write cache size is fragmentation. This is caused because PVS redirection is block based and not file based. The redirection to the write cache is based on the logical block level structure of the vDisk. To illustrate this, consider the scenario below.
Note again that for illustrative purposes we are using 8 clusters in a block while on the disk each block is composed of 512 clusters.
Looking at a section of the vDisk that has existing data on it, consider what happens when data is fragmented across multiple clusters. The OS will write data to the free clusters that are available to it. As it does this, the PVS driver will redirect this data to the write cache and create 2MB blocks to store it. However, the clusters in the 2MB blocks on the write cache correspond to the clusters that the OS sees and therefore only a few clusters within each block are used and the remainder is unutilized.
As is shown below, six 1KB (6KB) files can actually result in a 6MB increase to the write cache! Consider segments such as this all over the vDisk and the result is a far larger write cache drive.

The results shown in the previous section are of vDisks that were not defragmented prior to testing. Once the vDisk is defragmented, the areas of the disk should be arranged more like the visual below. In this case new data that is written will utilize the space much more efficiently resulting in a smaller write cache size.
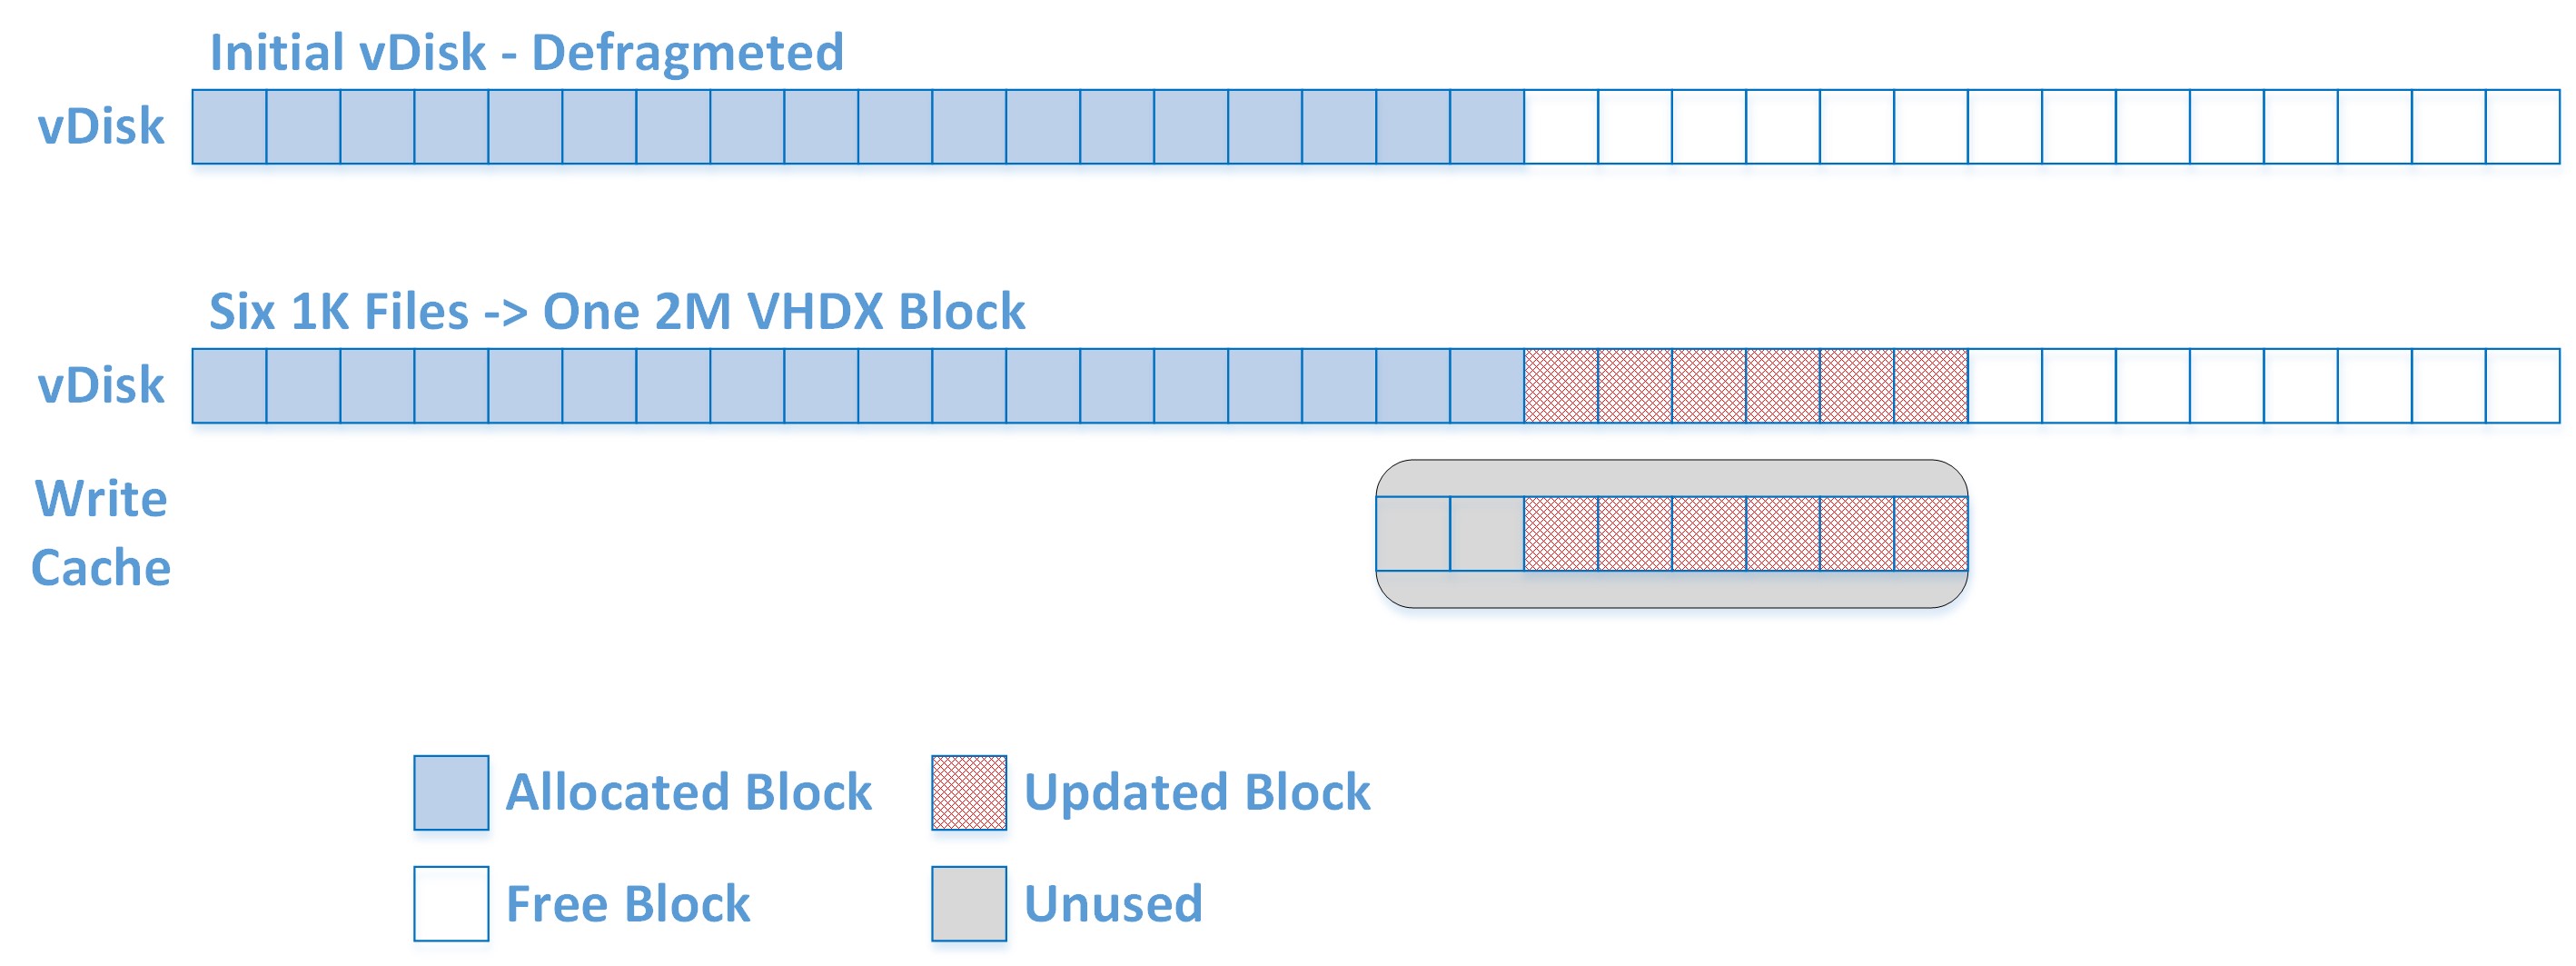
Let’s look at the tests again, this time after defragmenting the vDisk. We can immediately see that although defragmentation does affect the cache on HDD size, it has a much greater impact when using the RAM cache with overflow option. Now although the write cache is reduced, it is not completely minimized as certain files may not be defragmented. The test on Windows 7 was still significantly higher when using the default RAM buffer, but is actually lower when using a 256MB RAM buffer.
In the case of Server 2012 R2 which had a high 16% fragmentation, the write cache size drops by over 30% after defragmentation. Once a larger RAM buffer is added the write cache drops significantly lower than the cache in HDD option.

To illustrate how the disk may not be completely defragmented, refer to the following test run. In this test we created 25,000 x 1KB files, a little extreme but done to help prove a point. As can be seen below, the first several thousand files quickly grow the write cache as they are written by the OS to partially fragmented portions of the disk. Once those portions of the disk are occupied, the remaining files are written consecutively and the write cache grows at a much slower pace.

Final Caveat
The final scenario to consider which can impact the size of the write cache with the RAM Cache Overflow option is when pre-existing data on the vDisk is modified. In this case a file which was already on the vDisk such as a system file. Should this file be modified the change will be redirected to the write cache and those clusters modified. This again can result in underutilized space as 2MB blocks are created on the write cache for changes that are far smaller as can be seen below.
In this case defragmentation cannot mitigate the issue and the potential for a larger write cache still exists.

Test Methodology
The test methodology included two rounds of testing to compare the write cache size. The first round used an automated office worker workload on both Windows 7 and Server 2012R2. Each test was performed 3 times for repeatability as follows:
- The vDisk write cache option was set for each scenario as described under test configurations below.
- A single target machine was booted up running PVS target software 7.1.3.
- A startup script was launched to log the size of the write cache to a file on a file share
- vdiskdif.vhdx was monitored for RAM cache with overflow option
- .vdiskcache was monitored for cache on device HDD option
- A typical office worker workload was simulated.
- A single user was simulated on Windows 7
- 40 users were simulated on Server 2012 R2
The second round of testing was performed to demonstrate the effect of small files on the write cache growth and was performed only on Windows 7. This was done by generating files of different sizes and comparing the write cache size. The file creation scenarios are outlined under test configuration below. Each test was performed 3 times for repeatability as follows:
- The vDisk write cache option was set for each scenario as described under test configurations below.
- A single target machine was booted up running PVS target software 7.1.3.
- A startup script was launched to log the size of the write cache to a file on a file share
- vdiskdif.vhdx was monitored for RAM cache with overflow option
- .vdiskcache was monitored for cache on device HDD option
- A second startup script was launched which generated data by creating an equal number of files of a specific size. There was no user login on the machine during the duration of the test.
Test Environment
The environment used for testing consisted of HP Gen7 (Infrastructure) and Gen8 (Targets) physical blade servers with excess capacity for the purposes of the tests. The components of interest are summarized below as well as a visual summary of the test environment. The entire environment was virtualized on Hyper-V 2012 R2. All PVS components were run using PVS Software 7.1.3.1 (Hotfix CPVS71003).
- 2 x Provisioning Services Servers on Windows 2012 R2
- 4 vCPU and 16GB vRAM
- 1 XenApp 7.5 Target Device on Windows 2012 R2
- 8 vCPU and 44GB of vRAM
- 50GB Write Cache Drive on EMC SAN
- 1 XenDesktop 7.5 Target Device on Windows 7 SP1 (64-bit)
- 2 vCPU and 3GB of vRAM
- 15GB Write Cache Drive on EMC SAN
- Optimized as per CTX127050
The environment used a 10Gbps core switch with 3Gbps allocated to PVS streaming
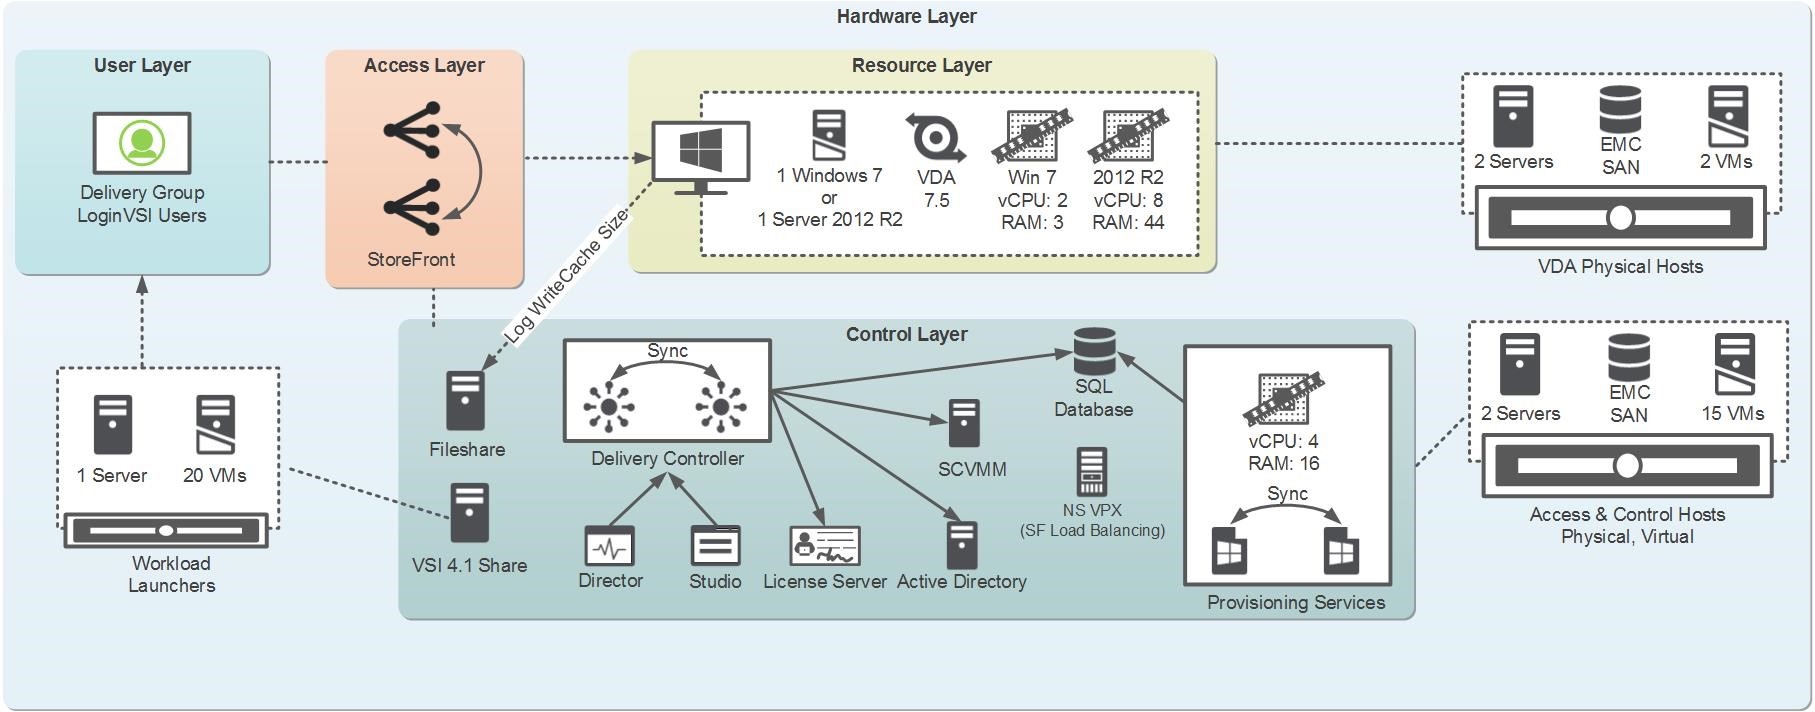
Click on environment diagram for larger view.
Test Configurations
There were three write cache configurations that were tested for both XenApp 7.5 and XenDesktop 7.5 to provide baseline and comparison write cache size data.
- 1. Cache on device hard disk:This provided a baseline disk size for the well know legacy write cache option. It was used for comparison against caching on the target device RAM with overflow to hard disk.
- 2. Cache on device RAM with overflow to hard disk (default 64MB): This test was performed to evaluate the growth of the write cache using the default RAM buffer.
- 3. Cache on device RAM with overflow to hard disk (optimized):This test was performed to evaluate the write cache disk growth when using a larger RAM buffer as is the current recommendation. RAM buffers of 256MB for Desktop OS and 2048MB for Server OS were tested. Note that with a large enough RAM buffer the write cache will never write to disk.
After additional investigation, several tests were repeated with a freshly defragmented disk to investigate the effects. The two vDisks the tests were run on were the following:
- The first set of runs on Windows 7 were tested on a versioned vDisk. The vDisk had a single version which was used to apply the optimization as best practice. On server 2012 R2 the first set of runs were on a base vDisk which was not defragmented and had a 16% fragmentation.
- The second set of runs used the same vDisk once it has been merged and defragmented. The fragmentation on the vDisk after merging was 1%.
Thanks for reading my post,
Amit Ben-Chanoch
Worldwide Consulting
Desktop & Apps Team
Project Accelerator
Virtual Desktop Handbook