One of Director’s finest features is the “Filters” page. With this feature we can analyze, drill down and focus on monitoring and troubleshooting things that matter. It also helps you analyze with ease and helps customers solve issues in a jiffy. Filters are explicitly divided into Machines, Sessions and Connections. Let’s deep dive into each one of them and check out how it can help an administrator troubleshoot and analyze issues.
Machines Filtering
In a XenApp/XenDesktop environment, machines can fail because of numerous reasons. An administrator needs to know when, where and why a failure occurred. The machines page in the “filters” view will help the administrator to find the issue and also understand the environment in detail.
The Machines panel gives you a picture of:
- All Machines
- Failed Machines – By major reasons
- Saved Machines Filter
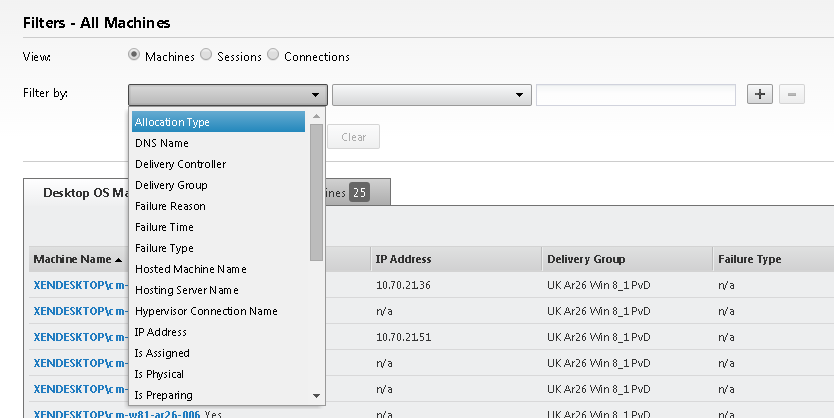
All Machines: Shows the details of all the Desktop and Server Machines @ site level. Server and desktop OS’s are shown in different tabs. Further filtering can be done based on the characteristics of XD. For e.g.:
Note: Sorting is allowed based on the listed details. This applies to wherever is sorting is allowed. By default sorting will happen on the first parameter listed in the result.
Failed Machines: Gives you picture of machines in different failure states. You can either choose All or one of the other failure types as shown below.
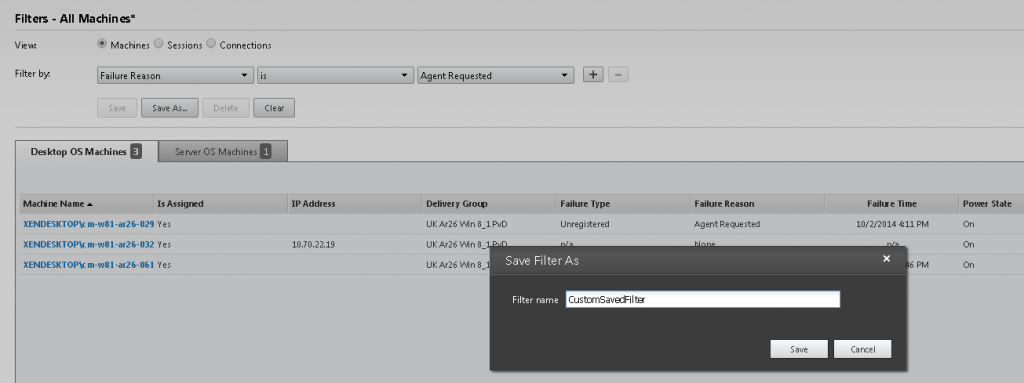
Saved Machine Filters: Now, if you want to create a customized filter by using any of the combination provided in the filter by criteria, you can do so using this. An example of a customized filter being created and saved.
Once saved you can go on using the same, from the main Filters tab. This is still available if you log off and log in back again.
Now, let’s go back and toggle down to Filters-Machines-All Machines.
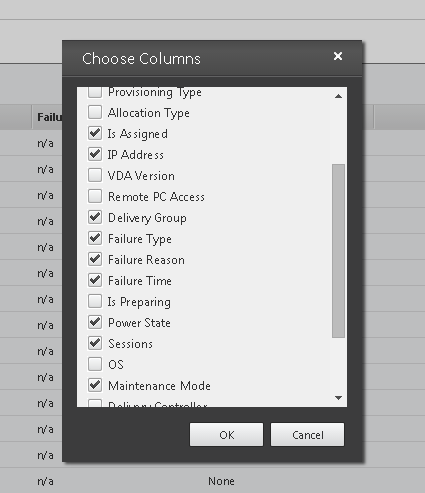
You will find the Desktop OS Machines detail grid that gives you a lot of information on the state of the Desktop OS Machines. You can even choose to add or remove columns from the grid as shown below.
The columns available for customization are:
Let’s see what the parameters in the columns are all about.
- Machine Name: The name of the machine registered to the XenDesktop.
- DNS Name: The DNS which resolves the machine.
- Machine Catalog: The catalog to which the machine belongs to.
- Is Physical: Is the machine a physical one and not a VM?
- Persist User Changes: How are the user profiles or user changes being persisted. Either On Personal v Disks or others.
- Provisioning Type: How was the machine provisioned? Was it using the MCS or PVS or Others?
- Allocation Type: How are the machines allocated? Are they static or pooled or random pooled?
- Is Assigned: Is the machine assigned
- IP Address: IP address of the machine.
- VDA Version: Version of the Virtual Desktop Agent
- Remote PC Access: Is the machine a Remote PC or not?
- Delivery Group: Name of the delivery group that the machine belongs to.
- Failure Type: The type of failure. More details in the section below.
- Failure Reason: The reason for failure. More details given below.
- Failure Time: The time when the failure occurred
- Is Preparing: Is the machine being prepared? (Explicitly for PvD enabled desktops. Is the machine being updated?)
- Power State: The power state of the machine such as On, Off etc.
- Sessions: Number of sessions active on that machine.
- OS: The operating system being run on that machine.
- Maintenance Mode: Is the machine in maintenance mode.
- Delivery Controller: The delivery controller name that the machine is associated too.
- Hypervisor Connection Name: The name of the hypervisor that the machines were spawned from.
- Hosting Server Name: DNS name of the hypervisor that is hosting the machine if managed.
- Hosted Machine Name: The friendly name of a hosted machine as used by its hypervisor. This is not necessarily the DNS name of the machine
- Pending Image Update: If the machine is in use because of which an image update is pending or when it is queued for an update.
- Load Evaluator Index: Load Evaluator Index associated with that machine.
Different failure types that can occur.
The failure types that can be filtered are:
- Client Connection Failures – Session failed to connect because of issues or compatibility with the client used by the user to start the session.
- Configuration Errors – Failures caused due to configuration errors.
- Machine Failures – Connection failures when the machine failed to start up or respond
- Unavailable Capacity – Capacity of VM’s or resource utilization has exceeded the maximum permissible limit owing which the connection has failed.
- Unavailable Licenses – Connection failure owing to unavailability licenses for spawning virtual machines.
The failure reason can be classified as:
- Session Preparation – Session prepare request from Broker service to VDA failed
- Registration Timeout – VDA did not register in time after being powered on for session launch
- Connection Timeout – Client did not connect to VDA after VDA was prepared for session launch.
- Licensing – License request failed (typically no license available).
- Ticketing – Licensing failed in general
- Other – General unresolved errors between client and VDI
- General Fail – General unresolved errors during initial brokering operation
- Maintenance Mode – Machine or delivery group in maintenance mode
- Application Disabled – Application can no longer be used and has been disabled by the admin
- License Feature Refused – Feature being used is not licensed (e.g. license doesn’t allow use of multi-session VDAs)
- Session Limit Reached – No more sessions allowed (e.g. launching second session on VDI VDA)
- Disallowed Protocol – Resource doesn’t allow protocol requested by session launch
- Resource Unavailable – Resource has been removed/disabled since enumeration
- Active Session Reconnect Disabled – Session is already connected to a different endpoint but session stealing is disabled
- No Session To Reconnect – Specified session could not be found during reconnect
- Spin up Failed – VDA could not be powered-on for session launch
- Refused – VDA actively refused session prepare request
- Configuration Set Failure – Failed to send required configuration data to VDA prior to session launch
- No Machine Available – No machine available for launch (e.g. all shared VDI machines in group are in use).
- Machine Not functional – Non-power-managed assigned machine not registered
You can also slice and dice into Machines
Failed Machines which provides you with 4 failure options to choose from.
- Failed to Start: All the machines that have failed to start up.
- Stuck on Boot: Machines that have started up but are stuck on boot.
- Unregistered: Machines that are not registered to the broker.
- Maximum Load: When machines are on maximum load (applicable to XenApp Server OS machines only)
Sessions
If the admin needs to figure out more details about the sessions hosted on XenApp/XenDesktop, they can use the Filters – Sessions page. It gives a plethora of information about the sessions and its users which is helpful in figuring out or fixing issues.
Similar to the machines page you can create custom saved filters for sessions and you can also choose columns for the grid depending on what is important to you.
Let’s see what each parameter means.
- Associated User: The user associated with the session
- Associated User UPN: User Principal Name – has two parts: the UPN prefix (the user account name) and the UPN suffix (a DNS domain name). The parts are joined together by the ‘at’ sign (@) symbol to make the complete UPN.
- Associated User Display Name: Username in the form of DOMAIN\UserName
- Session State: The state of the session. Is it connected or disconnected.
- Session Start Time: The time when the session started.
- Session Change Time: Time taken for a session change
- Anonymous: Defines whether a session is anonymous or not
- Endpoint Name: Name of the endpoint device for the session
- Endpoint IP: The endpoint device IP address.
- Receiver Version: The version of the Citrix Receiver installed on the endpoint.
- Connection Type: Whether it is a HDX or a Console session.
- Machine Name: The name of the machine
- DNS Name: The DNS name
- Machine Catalogue: The name of the catalogue that the machine belongs to.
- IP Address: IP address of the machine hosting the session.
- VDA Version: Version of the Citrix Virtual Delivery Agent (VDA) installed on the machine
- Delivery Group: The delivery group name
- Session Support: Is a session support available?
- OS: The name of the operating system.
Connections
The connections tab can give you a picture of the state of all the connections to your XenApp/XenDesktop environment. Image a customer complaining that his session is too slow and lacks responsiveness. You can connect to this session and find out detailed information about his connections. Say he was using a console instead of HDX. The “Connection Type” would clearly give that detail to you and you would be able to let the customer know the reason why he is experiencing a lag in performance.
All Connection: Lists all the connection in the XenDesktop
Failed Connections: Give a picture of all the failed connections in the XenDesktop. It can be further broken down into –
- Client Connection Failures: Failure occurring because the client’s connection to the network has failed.
- Configuration Errors: Failure due to configuration issues.
- Machine Failures:
- Unavailable Capacity: Failure because new machines could not be assigned because of 100% capacity.
- Unavailable Licenses: Failure due to insufficient licenses.
You can also select the time period while creating a filter rule.
The Filters –All Connections grid gives a holistic view of the XenDesktop connections and all it’s important parameters.
A few parameters that are unique to the Filters – All Connections pages are:
- Brokering Duration (ms): The time taken for the DDC to broker the session or connection.
- Connection via: The hostname of the device via which the connection is made.
- Connection via (IP): The IP address of the device via which the connection is made.
- Secure ICA: Is ICA encrypted securely with the Secure ICA feature.
- Session Support: Whether it is a single session support or a multi session support.
All these things together make troubleshooting a XenApp/XenDesktop environment simple and effective. Customer response times are greatly reduced as the administrator can effectively filter the plethora of information in front of him and zoom in on the one that can solve the issue.


