
Supercharge your Wireshark!
Troubleshooting many of the issues that occur in TCP networks can be rather challenging if you don’t leverage the correct tools. Fortunately the wise folk at Citrix have integrated excellent tracing capabilities into the NetScaler appliance.
This tutorial is not specifically focused on how to use the NetScaler tracing tool, but instead it’s focused on how to empower your default Wireshark configuration with simple customizations to help you diagnose a variety of TCP-related issues much more efficiently. That being said, here are a few CTX articles that will provide you guidance in taking a NetScaler trace:
How to Capture an Nstrace from the Command Line Interface of Netscaler Appliance:
http://support.citrix.com/article/CTX120941
How to Record Network Packet Trace on NetScaler Appliance:
http://support.citrix.com/article/CTX128655
Download Wireshark at your own risk:
You can download the latest stable copy of Wireshark at the following URL: http://www.wireshark.org/
I personally like to keep up-to-date on the bleeding edge versions of Wireshark, so I navigate to the developers section to find the very latest builds: http://www.wireshark.org/download/automated/
There are two key modifications that I make to my default Wireshark configuration.
- I add select columns to the default view
- I create custom filter menu buttons
Let’s first take a look at how I create custom columns.
Custom Columns
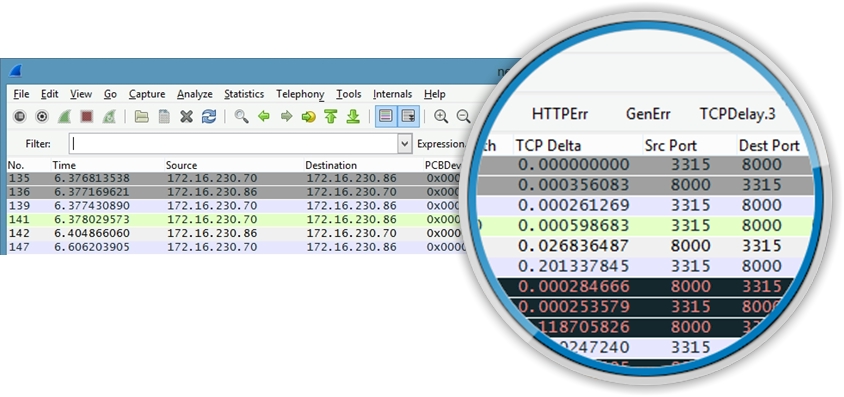
You can see in the following graphic that I’ve added a few different columns to my configuration. I’ve added PCBDev, Link PCBDev, TCP Strm and TCP Delta as column options. I actually have quite a few more custom columns defined.

Adding custom columns to the default Wireshark view can provide very quick insight without having to navigate into the packet details section to hunt for the desired details. In the example provided above, the PCBDev column will show the front-end TCP connection detail (client <> NetScaler) and the Link PCBDev column will show the back-end TCP connection detail.
The TCP Strm column will show you the packet communication within one specific TCP connection. Having this particular column on your Wireshark configuration will help you to isolate specific source-to-destination TCP communication, preventing you from potentially confusing different TCP conversations in the traffic that you’re interested in analyzing.
During the initial three-way handshake, there won’t be any detail in the two PCBDev columns other than zeroes, as a TCP connection has not yet been established and memory allocation for the TCP connection won’t be reserved just yet.
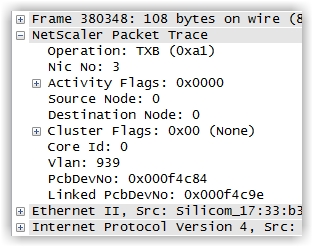
HOT TIP: One excellent plus with leveraging NetScaler traces is that the NetScaler will inject proprietary header information that can be extremely helpful when troubleshooting. You’ll see NIC, VLAN and PE details, as referenced below:
To add new columns, click on the “Edit preferences…” menu option in the toolbar and select Columns from the menu tree on the left:
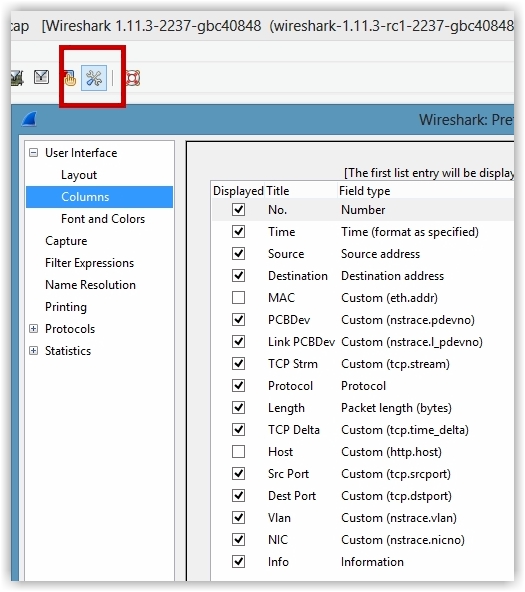
If you haven’t already made changes to your Wireshark configuration, you’ll see the default columns identified. You can see from this example that I have added quite a few different columns in my configuration; some checked and others not. The columns which are not checked will not show in the actual presentation view when examining packets in the trace.
Click the ‘Add’ option and select the appropriate ‘Field type’ (there are numerous built-in options). I’ve chosen ‘Custom’ in this example, as I want to create a non-built-in option. I also completed the ‘Field name’ with tcp.stream, as I want to see what TCP stream a particular packet is associated with.
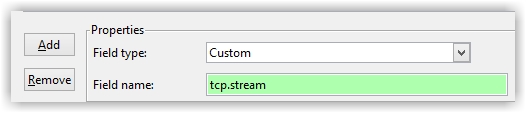
You will also need to add a name for ‘Title’ of the new custom column. Once you’ve created the new column option, click OK and the new column will be displayed appropriately.
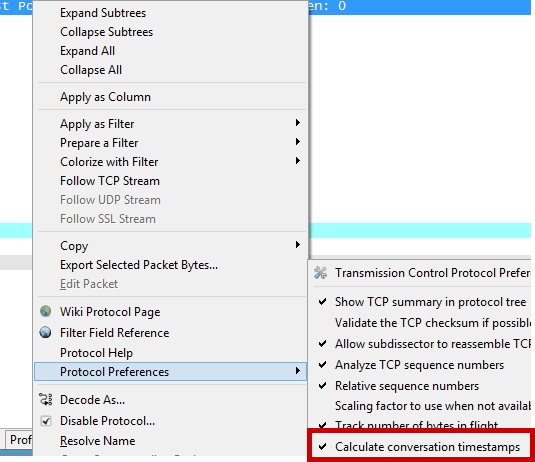
NOTE: If you want to find out the time delta between each respective packet (I highly encourage you to do such as it will tell if you if there is latency in request vs. response packets in a TCP stream), you will need to enable TCP time stamps. You can do such by right-clicking the TCP row in the packet details view, selecting ‘Protocol Preferences’, then selecting ‘Calculate conversation timestamps’. IMHO this is a must have for every Wireshark configuration.
So I’ve shown you how to easily add new columns to your Wireshark configuration via the menu option. You can also add columns really quickly by right-clicking an element in the packet detail view and selecting ‘Apply as a Column’. You may need to shift the layout of the columns with a click-n-drag of the mouse.

Let’s now shift our focus on creating custom filter menu buttons.
Open a Wireshark trace and enter the following expression in the filter box:
tcp.analysis.flags && !tcp.analysis.window_update

Click ‘Save’ and you’ll be presented with the following dialogue box:
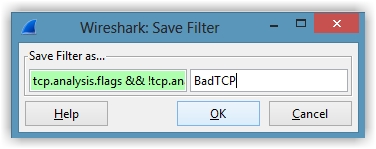
Enter the name “BadTCP” and click the ‘OK’ button. The new BadTCP button will be visible on the menu area of Wireshark.
Now anytime that you open a new trace, you can simply click the ‘BadTCP’ button and the filter will be instantly applied to the trace file, showing you if there are any TCP packets that you should inspect for issues.

I’m sure that you can now see the value of creating very complex filters that can be saved to the Wireshark menu area, which can be applied at the click of a button, with the results yielded. No longer will you have to remember what a particular filter is to troubleshoot packets.
Here are a few helpful filters that I use daily and the condensed names for each respective menu button:
DNS Errors
Name: DNSErr
Filter Expression: dns.flags.rcode > 0
HTTP Errors
Name: HTTPErr
Filter Expression: http.response.code > 399
General TCP Errors
Name: GenErr
Filter Expression: (dns.flags.rcode > 0) || (http.response.code > 399) || (smb.nt_status > 0 || smb2.nt_status > 0)
TCP Delay
Name: TCPDelay.3 (will find packets with a time delta from the previous packet greater than 300ms)
Filter Expression: ((tcp.time_delta >.3) && (tcp.flags.fin == 0)) && (tcp.flags.reset==0)
SYN Packets
Name: Syn (will show the first packet in a TCP three-way handshake)
Filter Expression: tcp.flags.syn == 1
GET and POST
Name: GET/POST
Filter Expression: http.request.method == “GET” or http.request.method == “POST”
Zero Windows
Name: ZeroWin (will find packets where the TCP buffer is full, potentially causing significant application delay)
Filter Expression: tcp.analysis.zero_window
TCP Window Full
Name: WindFull
Filter Expression: tcp.analysis.window_full
GET’s and RESPONSES
Name: GetnResponse (will show all of the GET’s and their associated responses)
Filter Expression: http.request or http.response