In this post, I’ll go over what data can be retrieved using the Monitor Service, a quick overview of what the URL’s are and some examples of basic data access using a browser.
The Monitor Service OData API includes quite a bit of data. Most of it falls under the category of XenDesktop Session information (including usage and errors). These are tracked historically and the length of time the data is kept is based on both licensing and user configuration. These settings can be changed with the set-monitorconfiguration cmdlet. Please note – changing these settings should be done very carefully as you might end up with missing data in Director.
Using OData in a Web Browser
When developing these API’s – we discovered that a web browser is initially the easiest way to view the output of the query. In order to actually work with the data, you’ll quickly want move to something else like Microsoft Excel PowerPivot, LinqPad or programmatic access.
Chrome has an extension called the Advanced REST Client that we found useful. If you choose to view these URL’s in Internet Explorer, you should make sure to disable Feed reading view. This can be changed in Internet Options -> Content -> Feeds and Web Slices -> Settings. Once in that dialog, uncheck the Turn on feed reading view checkbox and once you save those settings by clicking OK, you’ll need to restart IE.
The documentation describes how to access the URL’s a few different ways here: http://support.citrix.com/proddocs/topic/xendesktop-7/cds-ms-odata-example.html
Discovering OData API’s
The Monitor Service exposes two main API’s for retrieving data. In all examples below, please replace localhost with the name of the XenDesktop Controller you are querying (if you are not on the machine itself). These API”s also require a XenDesktop Administrator to successfully retrieve data so you might be prompted for a username/password.
- Methods: http://localhost/Citrix/Monitor/Odata/v1/Methods/$metadata
- Data: http://localhost/Citrix/Monitor/Odata/v1/Data/$metadata
The $metadata url should be used to discover what is available. This is a very important document because it not only describes what is available from the URL, but it also can be used by programs that know how to read the OData syntax and allows them to programmatically generate client code that can be used to query the API’s. You can read more on the OData.org website describing the metadata format here: http://www.odata.org/documentation/odata-v2-documentation/overview/#3_Metadata_for_OData_Services.
Documentation of available methods to access these endpoints is here: http://support.citrix.com/proddocs/topic/xendesktop-7/cds-ms-odata-methods.html
Method API
This API is primarily used by Director for retrieving the historical chart data displayed.
Data API
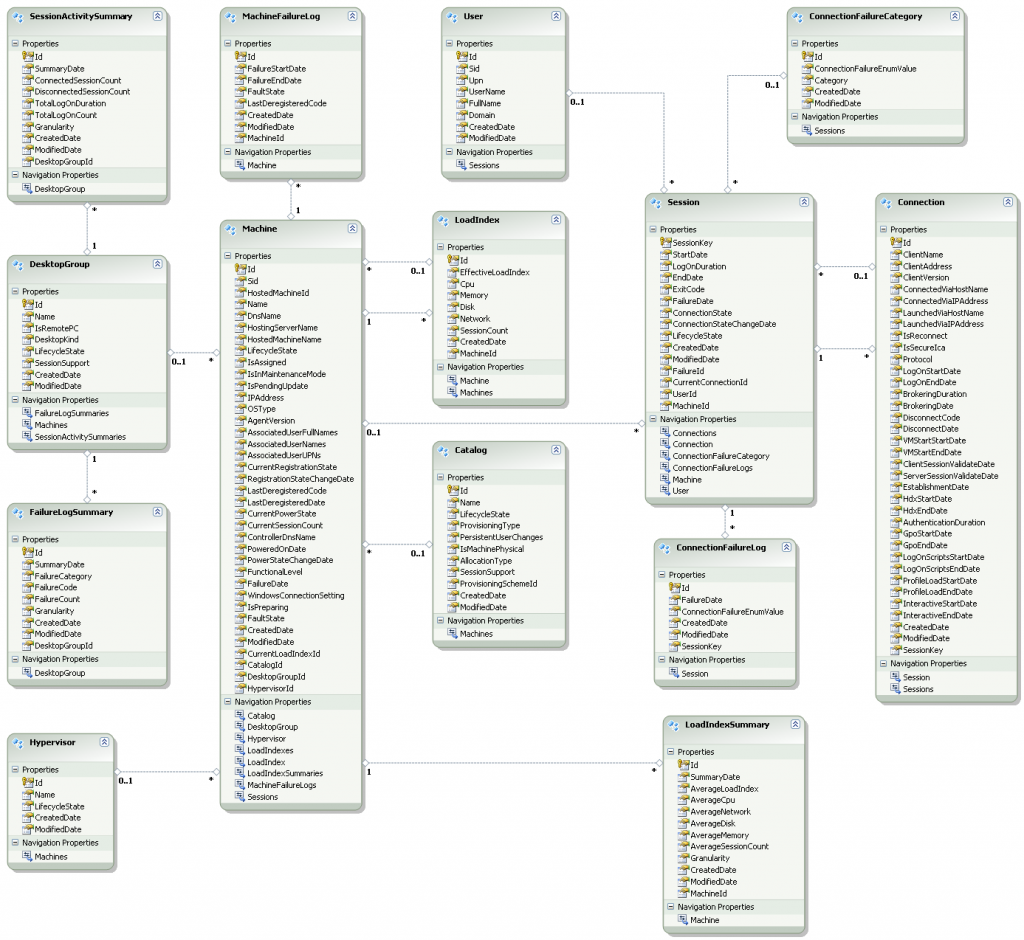
This API is far more flexible and provides access to all of the data that is collected by the Monitor Service. The documentation includes a schema diagram which I’ve included below. The lines between the boxes are also very useful in understanding which relationships the objects have.
Our goal in the naming was to make most of the objects self-explanatory. A basic description of each object is here:
System information tables
- DesktopGroup – Matches the Delivery Groups in Studio
- Catalog – These are Machine Catalogs in Studio
- Machine – These are the machines added to a Delivery Group in Studio
- Hypervisor – If a machine is hypervisor managed, very basic hypervisor information is stored in this table
- User – These are the users who have launched sessions – they are added as new sessions are created, so if a user never used XenDesktop, their information will not be in this table.
- Session – This is the high level session information, if a user launches a brand new session, a record will be in here, initial logon duration and current session connection information is also present. Session logoff is captured here as well, effectively concluding this record’s information.
- Connection – This is a child of a session record, for each new connection for the session, that information is tracked in these records. There can be many connections per session, depending on how many disconnects/reconnects the user has initiated over the lifetime of a session. This table also includes client version info as well as log on breakdown time stamps for the session log on.
- SessionActivitySummary – This table includes data that has been aggregated from the session and connection tables. Counts of logons, as well as connected/disconnected session counts are also captured in this table. This table is largely used for Director trend data, but can also be used to look at session counts for a Desktop Group (XenDesktop Delivery Group) over time.
- LoadIndexSummary – This captures the load index for Server OS machines. This information can provide valuable insight into overall system utilization and load.
- ConnectionFailureLog – Any time there is a connection error, a record is added to this table.
- ConnectionFailureCategory – This table includes categorization of connection failures – it is used for Director error categorization and does not include the granular error detail. It is a static table that does not change as errors occur.
- MachineFailureLog – This includes the machine failure state tracking. As machines move in and out of failure states and become available for use again, this table includes the start/end times and reasons for the failure.
- FailureLogSummary – This is aggregated data from the ConnectionFailureLog and MachineFailureLog tables. It includes the category/codes for failures and they are aggregated per Desktop Group (XenDesktop Delivery Group) over time. If that level of granularity is all you need, this is a good table for you.
A few example of queries you can run in a web browser follow:
- To retrieve all Users: http://localhost/Citrix/Monitor/OData/v1/Data/Users
- To retrieve all Sessions: http://localhost/Citrix/Monitor/OData/v1/Data/Sessions
- To retrieve all Sessions for all users in a specific domain: http://localhost/citrix/monitor/odata/v1/data/Sessions()?$filter=User/Domain eq ‘QALAB’