For the second year in a row, tests show Citrix Virtual Apps and Desktops™ on Azure [1] can decrease monthly costs by up to 43 percent as compared to VMware Horizon on Azure. In our previous test, released July 2019, we showed how Citrix Virtual Apps and Desktops on Azure decreases your monthly costs. Recent internal tests confirmed this once again. Citrix® maintains the lead as the low compute cost leader on Azure, as it also does for Azure Virtual Desktop (formerly Windows Virtual Desktop) workloads.
Running a D4V2 instance on Microsoft Azure with Azure Virtual Desktop workloads using Citrix Virtual Apps and Desktops, you can deploy up to 95 percent more users on the same instance as compared to VMware Horizon on Azure.
More sessions per instance will decreases your monthly fee. The average cost of a D4V2 instance on Azure is $450 USD per month; however, with Citrix Virtual Apps and Desktops, you can deliver 39 sessions on a Microsoft Windows 10 Enterprise multi-session host on Azure. With VMware Horizon on Azure, 20 is the maximum capacity.[2]
The graph below shows the Azure costs per user per month for a Windows 10 multi-session desktop (Azure Virtual Desktop). For different instances, it clearly highlights the cost benefit per month per user with Citrix versus VMware. [3] [4] Click the image to view larger.

For a customer with 1,000 sessions, using Citrix Virtual Apps and Desktops nets an $11,000 lower compute fee on Azure. At a rate of $450 a month, the cost to use VMware is nearly $23,000. The same environment with Citrix costs $12,000 per month.
The D4V2 is no exception here. If we look at the D3V2 we see similar results. A D3V2 is a less expensive instance — on average, it comes in at $225 per month. With Citrix Virtual Apps and Desktops, you can host up to 21 sessions on the instance as compared with VMware Horizon on Azure, on which only 11 sessions are possible.
Again, in a 1,000-user scenario, this equates to a compute fee of nearly $21,000 for VMware. With Citrix, the compute fee for Azure is approximately $11,000.
The graph below shows a standard workload on Windows 10 multi-session running, of course, on Azure. The graph clearly shows the difference in scalability between Citrix and VMware for different instances. Click the image to view larger, and keep reading for more information on the workload.

The question of course is, “Why bother? What do you or your customers gain from better scalability?”
The answer?
You’ll be able to deliver the same Windows 10 Azure Virtual Desktop workload with Citrix but for a lower monthly compute fee. For the same amount of money, you can give users a more powerful environment that will deliver an even better user experience. All of this is within range when using Citrix Virtual Apps and Desktops for your Azure Virtual Desktop workloads on Azure.
Now, let’s dive a little deeper.
The Environment
The tests we conducted were intended to show the differences between Citrix and VMware.
The user density tests were conducted with Login VSI[5] because that is the market standard for scalability and performance testing. We were intent on ensuring that test results are accurate and that tests are conducted properly. (Please let us know in the comments below if you identify any inconsistencies in the tests.)
The test environments were a Citrix Virtual Apps and Desktops environment and a VMware Horizon Cloud services environment, each running on Microsoft Azure and each running the same 1909 Windows 10 Enterprise multi-session instance.
| Platform | Version | Client version |
| Citrix Virtual Apps and Desktops (on Azure) | 2006 | Citrix Workspace App 2002 |
| VMware Horizon on Azure Extending Azure Virtual Desktop | 20.1.0 | VMware Horizon Client 5.4.2 |
Citrix Optimizer (v2.7.0.126) was used for the Citrix image. The VMware Horizon Cloud built-in optimizer was used to optimize the VMware Horizon images on Azure. Templates were on par with patches and software apart from the vendor-specific software. Resolution was forced to 1920×1080, everything was executed in full screen, and we prevented the OneDrive installer from running and disabled Microsoft Defender.
| Azure Client instances | Specs | Client quantity |
| A4 instance | 8vCPU/14GB | 5 |
Other infrastructure was created as required for the specific environment; this involved a D2v2 instance with VMware deployed as the node. This instance is a 2vCPU/7GB instance deployed from the VMware cloud console after creating a POD. All VMs used for the tests are rebooted each time and left idle for 10 minutes before testing starts.
| Azure instances | Specs | Compute fee per month (avg) |
| D4V3 | 4vCPU/16GB (HT) | $224 |
| D3V2 | 4vCPU/14GB | $225 |
| D4V2 | 8vCPU/28GB | $450 [6] |
All tests were conducted using a 128GB standard hard disk (non-SSD), and the Azure cost estimator was used to determine cost per month. Default pricing settings were selected; one-year reserve prices were used; and the total is average per month, rounded up to nearest dollar.
For the tests, the VMware Horizon and the Citrix Virtual Apps and Desktop environments were run in default state, with no specific tuning other than the default. The VMware Horizon cloud built-in optimizer was used to tune the VMware image. [7] For the Citrix side, we used Citrix EDT [8], and for VMware we used Blast Extreme. We did not test with VMware PCoIP because the preferred protocol for VMware is Blast Extreme.
We noticed, however, that VMware Horizon “Optimize Windows image” option did not deliver any scalability benefits. To ensure a level playing field, we tuned the VMware image with Citrix Optimizer. With optimization in place, Citrix Virtual Apps and Desktops still had up to 53 percent improved scalability than VMware Horizon on Azure — depending on the instance used. While VMware images in Horizon cloud are not tuned, Citrix images in Citrix Cloud are tuned and ready to go. (Delivering a great user experience is in Citrix’s DNA.) We decided to use the default option VMware provided — “optimize Windows image” — in our test.
The Knowledge worker Login VSI test was executed. The table below shows the applications used in the test. This is the same workload used in our previous test.
| Applications | Knowledge worker |
| Adobe Reader | * |
| Freemind/Java | * |
| Internet Explorer | * |
| Microsoft Excel | * |
| Microsoft Outlook | * |
| Microsoft PowerPoint | * |
| Microsoft Word | * |
| Photo viewer | * |
| DoroPDF | * |
The Results
As in our previous test, we executed two tests with multiple runs to make sure one-time errors did not skew the results:
- Logon as many users as possible, until VSI Max [9] is reached
- Logon x users (maximum of either Citrix or VMware) and monitor metrics.
Why did we do two tests? Why not see how many can log on and be done with it? The first test was most important for us. Just as in last year’s test, we wanted to show the difference in scalability between Citrix and VMware when running Azure Virtual Desktop workloads on Azure.
The results are clear, Citrix outperforms VMware hands down. We increased user scalability by 95 percent. Yes, both Citrix and VMware have different system load metrics. To ensure that our comparison was “apples to apples,” it was necessary to run the second test and load the system with the maximum user load VMware could handle so we could see CPU usage.
During the first test, we found the VSI Max for both Citrix and VMware. We used the lowest number (reached by VMware) as the baseline for the second test. The first test results are shown in the graph below.
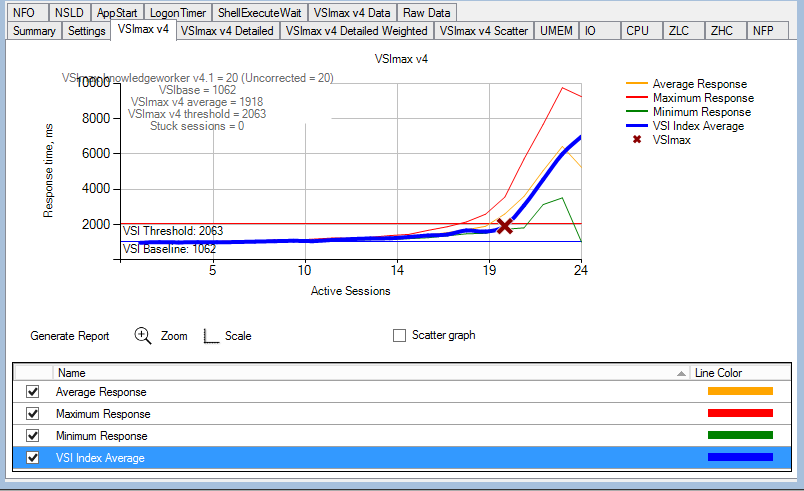
The graph shows that VMware Horizon reached VSI Max at 24 sessions, but there is another interesting metric to consider here, as well. With 20 users online and VMware Horizon on Azure extending Azure Virtual Desktop, running Windows 10 multi-session crosses the response threshold of 1000ms over the baseline.
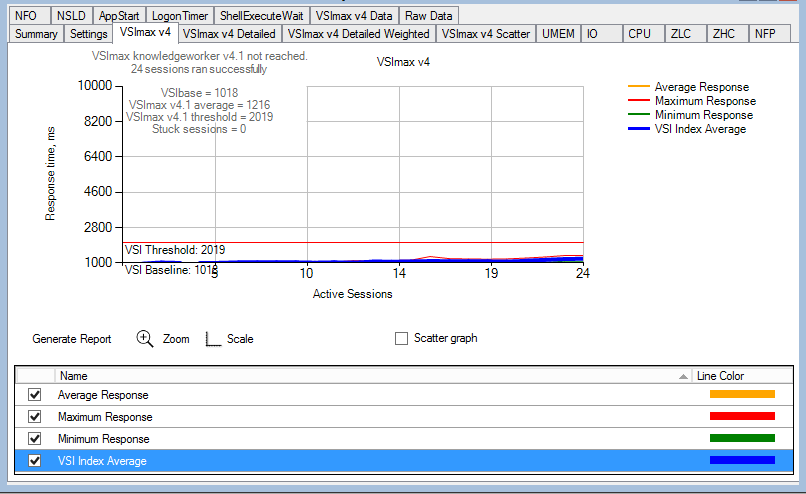
If we compare that to Citrix Virtual Apps and Desktops on Azure in the graph below, we see that Citrix is not reaching VSI MAX, and 24 users are logged on. Of course, this baseline of 24 users was low for Citrix. We would never reach VSI Max with this number of users. But that is the idea behind it: We tested with the maximum VMware could handle and looked at other metrics. Looking at the x-axis again, it becomes clear that Citrix runs at a lower response time than VMware. Average response time is 1026ms for Citrix vs 2062ms for VMware. Talk about a great user experience!
We noticed during testing that VMBlastW.exe and VMBlastS.exe processes were still using a massive amount of CPU time. When we looked at the overall usage of CPU and available RAM, the VMware CPU usage stood out.
The graph below shows the D4V2 Microsoft Azure instance with the CPU usage spiking with just 24 users. Conversely, the Citrix instance handles the 24 users with ease.

Please note, Citrix conducted the user density and scalability tests in May and June 2020. Tests were conducted on available versions of software provided by VMware in the Azure cloud offering. They were based on the findings and assessments of Citrix test engineers and on industry best practices used for testing.
Let Citrix help you decrease compute costs for running desktops on Azure. Contact your sales rep or partner today for more information. Learn how you can reduce IT costs and increase efficiency with Citrix and cloud VDI solutions on Microsoft Azure.
[1] Based on compute costs, not taking into account required infrastructure.
[2] Based on a Login VSI Knowledge worker workload.
[3] CVAD = Citrix Virtual Apps and Desktops
[4] TW+ = Thinwire
[5] Login VSI
[6] Azure region East US
[7] Deciding to Optimize the Windows Image When Using the Import Virtual Machine from Marketplace Wizard
[8] Citrix Enlightened data transport protocol
[9] Link no longer available