
This blog was co-authored by Pooja Vivekanandan, Senior Product Manager at Citrix.
Citrix administrators and help desk teams are constantly on the lookout for tools that simplify the way they manage Citrix sessions & troubleshoot performance issues. Citrix Director’s new Trends for Session Experience metrics dashboard can help.

This agentless solution, part of your on-premises Citrix Virtual Apps & Desktops 2308 environment, is a game-changer for admins. Streamline session experience troubleshooting without the need for additional agents or Citrix Analytics integration to your environment. This feature – along with other new enhancements – will also be available soon to customers with Citrix DaaS and Citrix Monitor.
The agentless advantage
The beauty of this feature lies in its simplicity. There’s no need for an additional agent or to connect with a SaaS offering like Citrix Analytics or NetScaler ADM service. The term “agentless” isn’t just a buzzword; it’s the promise of efficient monitoring out of the box, without added layers of complexity or tools.
For Citrix administrators, this means more insights with less overhead for the duration of the whole session — a win-win!
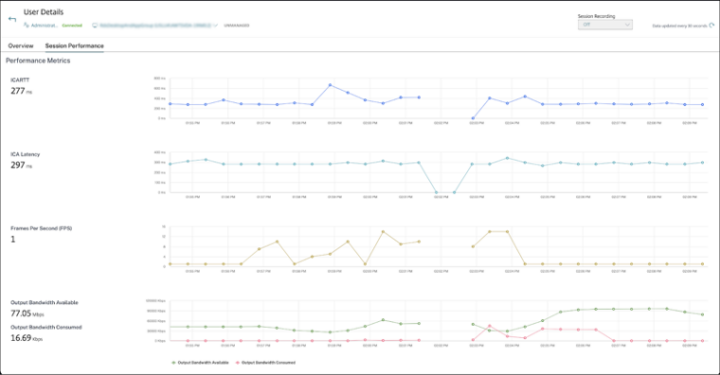
Let’s take a closer look at some of the metrics the dashboard provides – specifically ICARTT, ICA Latency, and Network Latency.
Unveiling the ICARTT mystery
One of the terms you might have come across in your Citrix journey – or at least looking at the Citrix Director’s “User Details” tab – is “ICARTT” (ICA Round Trip Time).
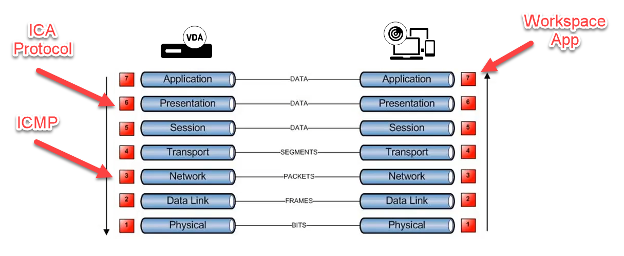
ICARTT is the time taken from the moment a user presses a key inside the Published Application or Published Desktop session until they see the result on their screen. This isn’t something calculated by tools like NetScaler; it’s determined at the Citrix Virtual Apps & Desktops or Citrix DaaS level, though it can be picked up by NetScaler too.
ICARTT is crucial because it covers the real application delay, which includes:
- Processing delay introduced by the Client OS
- Network delay from the Client to NetScaler or Gateway Service (WAN Latency)
- Delay caused by NetScaler or Gateway Service for processing traffic from client to NetScaler / Gateway Service (Client Side Device Latency)
- Delay processing traffic from Netscaler to Server (VDA) (Server Side Device Latency)
- Network delay between NetScaler and Server (DC Latency)
- Delay introduced by the Server (VDA) OS (Host Delay)
When NetScaler is connected with ADM, the ICARTT value is broken down into the three segments of WAN-, DC-, and Host-Latency.
Why ICA Latency and ICARTT aren’t the same
ICA Latency is the network’s delay the Citrix Independent Computing Architecture Procotcol (ICA) is experiencing. It is important to understand that the value for ICA Latency will likely be slightly higher than a simple ICMP “network ping” would return, as the ICA latency is calculated on a different level of the OSI-Layer.
ICA Latency provides a glimpse into whether your network is underperforming or the connection type like WiFi or LTE itself is unstable.
Speaking of WiFi and LTE: if, for example, a user is hopping between WiFi Hotspots or LTE antennas, you may notice ICA Latency actually being lower than the network latency a ICMP ping would return. That’s when the ICA protocol is working its magic to prevent negative impact on the user experience.
However, ICARTT encompasses more, like the application’s actual delay. This is why using an outdated thin client or Online Plugin 11 in combination with a HDX 3D Pro stream will very likely have a high ICARTT and low ICA latency. In such a scenario where the endpoint is lacking the performance to compute the graphics, this will result in additional delay and with this a higher ICA Round-Trip-Time.
Similar behavior can be expected with an overloaded session host, not capable of processing the user input and processing of the screen updates into the ICA protocol.
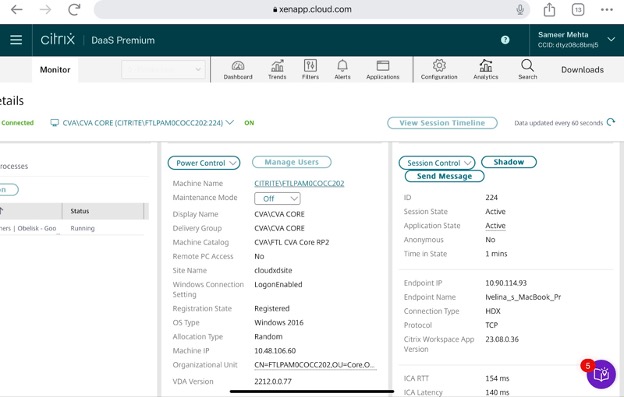
Let’s confirm this with a lab machine: While the ping from the endpoint to the NetScaler Gateway used to be around 110ms, ICA Latency was at 125ms. Take a note of the 304ms ICARTT caused by a 4k YouTube video that was running inside the session host, consuming more than 50% CPU resources.

Other Essential Metrics
Frames Per Second: This metric is vital in indicating session responsiveness, but also the overall use – including the screen updates rendered and transmitted to the user. Due to the adaptive nature of the Citrix protocol, when there is no screen update or user interaction, there is no frame update. A drop to 1 FPS is considered normal.
Looking at FPS, we should also keep in mind if a session host is making use of AMD or NVIDIA graphic cards. Further, when reviewing FPS performance consider if the selected graphics policies are supported by the endpoint and its Workspace app.
The endpoint, you ask? Yes! Certain graphics modes make use of video codecs for better performance and compression which not only require a certain Workspace App version but also a graphics card capable of decoding it.
Refer to this blog to learn more about H.265, AV1 and YUV4:4:4 requirements with Citrix.
A great reference showcasing the difference HDX & HDX 3D Pro can make compared to a non-citrix optimized environment below:
Output Bandwidth Available and Consumed: These metrics measure and estimate the total bandwidth available for data transmission from the VDA to the endpoint and provide the value as megabits per second.
The “Consumed Bandwidth” metric is measuring the ICA channel throughput per-session and is not reflecting the traffic on the session host to the internet or internal network. In other words: a speed test or large file transfer won’t cause a spike in the graph.
Analyzing these helps ascertain if there’s sufficient bandwidth for sessions and whether any session suffers because, for example, family members started to stream movies while working from home.
Why These Metrics Matter
Consider this: video or audio streaming can withstand more latency without buffering interruptions, but issues arise when faced with jitter or limited bandwidth. Teleconferencing? They need less jitter and latency as we’ve all noticed.
Consider making use of Microsoft Teams optimization to improve these values.
Desktop applications, on the other hand, can bear even more latency. Yet, the type of app can change your threshold. Precision applications like AutoCAD require lower latency, while latency is a lesser concern for apps like Microsoft Word, as we saw in the HDX 3D Pro video above.
The overall available bandwidth will play a crucial role when there is a lot of printing involved, while bandwidth is a constraint – let’s say in warehouses, or remote located retail stores for example.
Trends for Session Experience Metrics: A game-changer
Citrix Director’s new feature, “Trends for Session Experience metrics,” is here to revolutionize the way you monitor and troubleshoot. The enhanced Session Experience tab now offers the ability to correlate real-time metrics, providing a comprehensive view of issues within user sessions.
Conclusion
With Citrix Director’s new feature, administrators now have a robust, agentless tool at their disposal, making the task of troubleshooting and monitoring Citrix more intuitive and efficient – at no extra cost!
As the world of virtualization and remote computing continues to evolve, features like these ensure that Citrix remains at the forefront, offering solutions that are both innovative and user-friendly.
Disclaimer: This publication may include references to the planned testing, release and/or availability of Cloud Software Group, Inc. products and services. The information provided in this publication is for informational purposes only, its contents are subject to change without notice, and it should not be relied on in making a purchasing decision. The information is not a commitment, promise or legal obligation to deliver any material, code, or functionality. The development, release, and timing of any features or functionality described for products remains at the sole discretion of Cloud Software Group, Inc.