Introduction
You must be happy with the benefits of Director for troubleshooting and monitoring the Citrix XenDesktop. I will give some tips on how to troubleshoot the Director issues with help of logs. Supportability is very important aspect of the Citrix. Director has enabled logging at its components. Logs give better idea on what went wrong when the specific operation is performed. Director captures various logs like CDF, Events and Power-Shell commands for below components
- Director Web Service
- Director VDA Plugin
Configure
Web Service
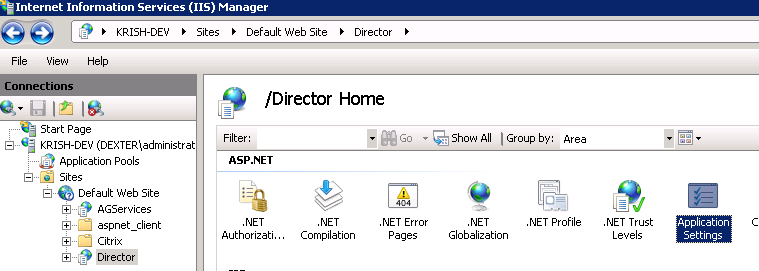
- Open Internet Information Services (IIS) Manager using inetmgr command.
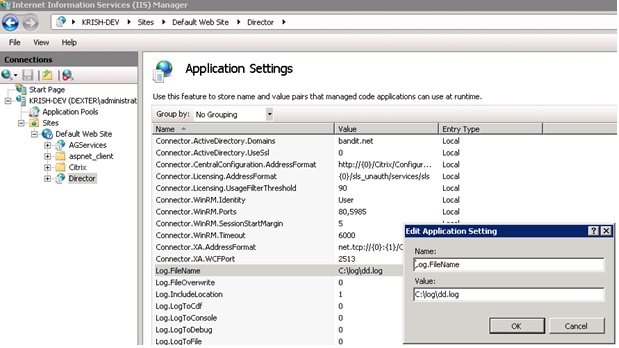
- Go to Director website and open Application Settings.

- Log.FileName indicates the log file path.
Log.IncludeLocation flag enables the source code file name and line numbers to be included in log file.
Log.FileOverWrite flag will overwrite the existing log file for first time.
Log.LogToCdfwill enable logs to be collected by CDF Control tool.
- Restart the Internet Information Services(IIS) to apply the above settings.
Virtual Desktop Agent
- Go to VDA install location. Default path is %SystemDrive%\ Program Files\Citrix\Virtual Desktop Agent.
- Open the DirectorVDAPlugin.config.
- Configure the File logging/CDF logging settings.
Capture/Collect logs
- File logs are collected automatically in log file.
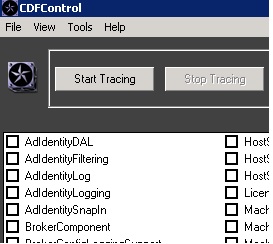
- CDF logs are collected using the CDF Control.
- Open CDF Control and Select the modules for the logs to be collected.

- For Director web service choose DirectorService.
- On VDI/RDS sessions choose DirectorPlugin. These logs can be collected remotely.
- Director depends upon Broker and Monitoring service for getting information. It is better to collect the logs for those components as well.
- Click on Start tracing and reproduce the scenario.
- After reproduction, click on “Start Consuming” to stop the trace.
- Now open the trace using Parse trace menu shortcut.
- Select the Event tracing file from file system
Analyse Logs and Troubleshoot
Event logs show catastrophic errors and high severe errors.
Event logs
- You can open the “Event Viewer” from Start menu.
- Event log is formatted on columns {Level, Time, Source etc.}. Level can be Information, Warning and Error.
- Event Detail shows the message for event.
-

- It shows that there is an error while connecting to core services. It gives information that web service is not able to reach the machine. It helps you to troubleshoot whether Server machine is online and able to reach the machine from Director Machine.
- You will see similar event logs on Virtual machine where it is unable to register with Controller.
File Logs/CDF Logs
- Firebug tool helps you to find which API has failed from UI. For more information on Firebug, find here.

- Find the API name from firebug UI and search in Web service logs/traces.
- Logs contains information about Time, ThreadId, Message etc.

- Search API failure and find the log snippet in Director Logs. For every UI API, there is an Entry log message and Exit log message. You can find the latest API log snippet by searching from bottom to top in log file.After you find the Entry message, follow the thread from top to bottom. ThreadId is 12 in below log snippet.

- Log contains error information which is useful for troubleshooting.

- PowerShell allows you to access the Controller objects and analyze the information. Director logs also print PowerShell equivalent commands for all the Controller APIs.
- Load the PowerShell snapins and run the PowerShell commands. Run Get-Command to know the list of commands.

- Find the list of running sessions with Get-BrokerSession command

- Many of the APIs are going to OData Web service where the OData URI is being printed in logs. You can execute the URI inside browser and check results. You can find more help here.

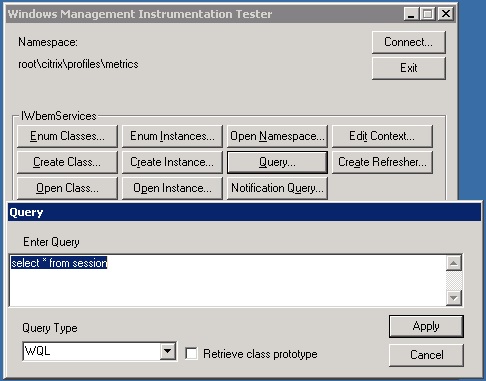
- Some of the data is coming from WMI sources. WMI queries are printed in logs. WMI queries can be debugged by wbemtest tool from Start Menu.
- Profiles data can be debugged by running WMI queries.


