
Director : Client Side Troubleshooting with Tools like Firebug
Sometimes when you are looking at Director Data, you may wonder what is going on the background and where this data is coming from. You can use existing tools to find out the same and to troubleshoot Director Issues. A tool used by Citrix most often to troubleshoot these is Firebug.
After reading this Blog you will be able to give answer of following questions.
1) What is Firebug?
2) How to install Firebug?
3) How to troubleshoot Citrix Director with Firebug?
What is Firebug?
Firebug is an extension or Add-on for Mozilla Firefox, Google Chrome, and Safari etc. Internet Explorer, Google Chrome and Apple Safari also comes with a built-in developer tool that is also like Firebug and can be used to troubleshoot Director. Firebug allows user to debug and inspect HTML, CSS, the document object model (DOM) and JavaScript while browsing the website. It detects the performance of website and track cookies and sessions. We will discuss troubleshooting of Director with Mozilla Firefox, Internet Explorer and Google Chrome only.
How to install Firebug?
There are two ways to install Firebug on your machine.
1) Open Firefox, go to Tools>Addons>Get Addons and then search for Firebug. Now click on install. Restart after installing and you are all set to use Firebug now.
2) You can go to getfirebug.com and click on “Install Firebug for Firefox” button.
Internet Explorer, Google Chrome and Apple Safari comes with in built developer tool which can be open by pressing F12 key.
How to troubleshoot Director?
1. Using Firefox with Firebug:
After installing the Firebug you will be able to see a gray “Firebug” Icon in the Firefox Navigation toolbar. Click on the Icon to start. Or press F12 to start the Firebug.

After starting Firebug you will be able to see Firebug toolbar. This Firebug toolbar is shown below.
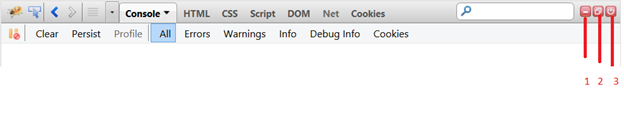 Firebug toolbar is having seven panels.
Console Panel: This panel shows all calls made to server from the browser. This panel fulfill the most part of our purpose of troubleshoot Director. So we will be discussing this panel in detail. Other panels mainly used by developer for testing the website.
HTML Panel: This panel shows the html code of the web page opened in that particular browser tab.
CSS Panel: This panel shows the CSS used in current web page.
Script Panel: This panel shows all the scripts used in current web page.
DOM Panel: This panel shows list of all DOM objects.
Net Panel: This panel is used to monitor the calls made from browser to server.
Cookies Panel: This panel shows what different cookies are set to establish the trust between frontend and backend for this particular session.
Now we will discuss steps to be followed for troubleshooting Director.
Open Director Website in the Firefox browser. Open the Firebug either pressing F12 or clicking on the bug in right side navigation toolbar of browser. Then you will have Firebug UI at bottom of Director Tab in browser. By clicking on Icon in Firebug panel you will get “Firebug UI location” option to relocate this UI. Select the console panel from the Firebug toolbar and then select “All” tab under console panel.
Console Panel:
This Panel is widely used for troubleshooting in Citrix. As soon as you login to Director this panel starts showing all calls made to Director back-end from the browser. One can see the time taken by the call starting from making a request to getting the response. One can also see some number just after the API name. This number is a HTTP status code. If call is followed by code 200 it means that call has been successfully returned the response from server. If code is other than 200 then it means that call might has been failed in getting the response from server.
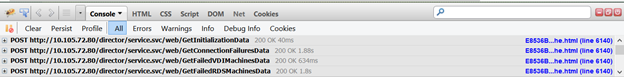
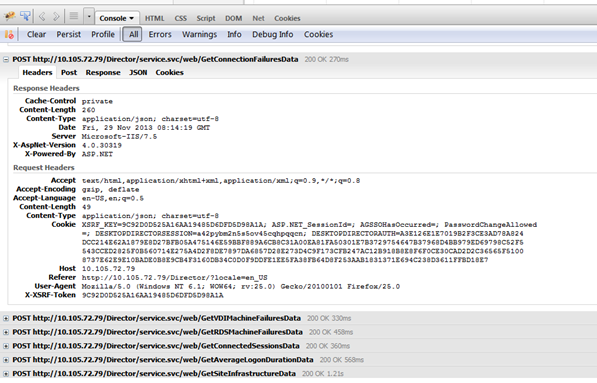
User can see the response of particular call by clicking on that call. User will see five tabs under that call.
Headers: This tab shows the header of that call. This shows cookie, X-XSRF-Token, Host, content length etc.
Post: This tab shows the parameters sent to the back-end. User should check that if passed parameters are correct or not.
Response: This tab shows the response received from the back-end in simple text form.
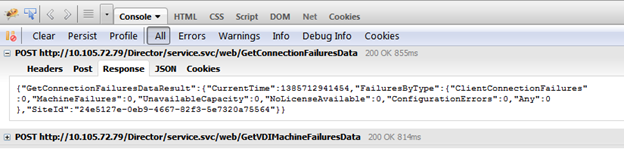
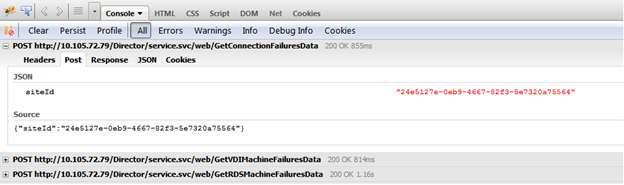
JSON: This tab shows the response received from back-end in JSON form. User can check whether values received from backend are correct or not.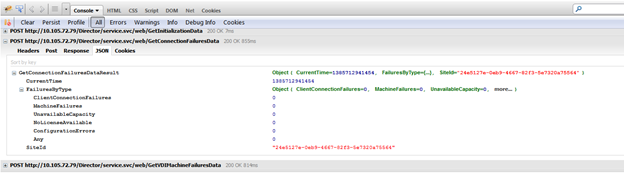
Cookies: This tab shows the cookies used for making this call.
1.1 Troubleshoot a call Failure
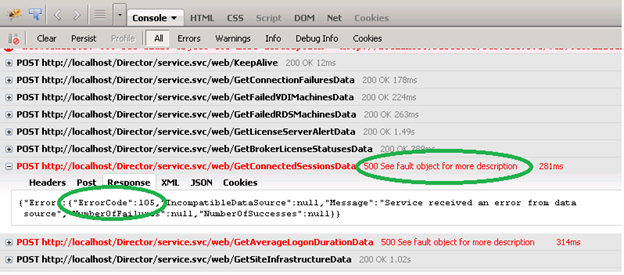
Sometimes you see some red calls followed by code 500 in console panel as shown in below screenshot. This means these calls have been failed because of some reason. When you double click on such call you get some error code and details about the failure in response. As shown in screenshot below GetConnectedSessionData call is failing with error code 105.
Error code 105: DNS server is not looking up.
So this is the cause of failure of this call and you need to give correct DNS server name. You can get the error code from Firebug and look for what that error code means here.
2. Using Internet Explorer:
IE comes with custom build developer tool that can be used to troubleshoot Director. Press F12 key to start this tool.
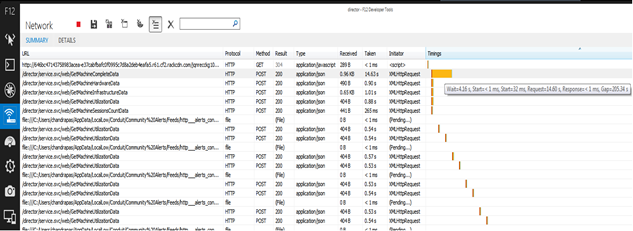
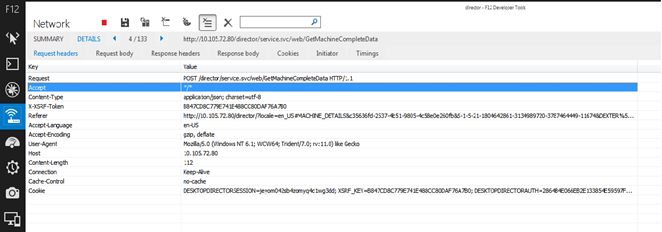
This tool has eight panels but mainly one panel is required to troubleshoot Director which is called Network panel. As soon as any call sends from UI to Back-end this tool capture it.
You can get detail view of that call by clicking on the call. Below is the screenshot of request header of that call. It is more or like we saw in previous section.
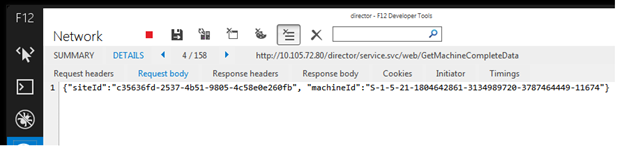
Below is the screenshot of requested body of the call.
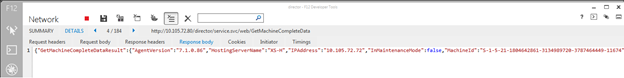
Below is the screenshot of response body of that call.
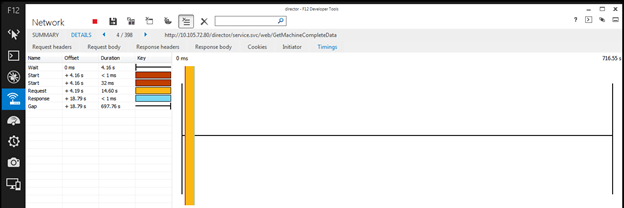
Below is the screen shot of time spent by that call in getting back the result.
Steps of debugging a call failure is quite similar to the steps we discuss in previous section of Firefox.
3. Using Google Chrome:
Google Chrome also comes with custom build developer tool that can be used to troubleshoot Director. Firebug lite version also available for Chrome browser which can be used to troubleshoot Director. Google Chrome version 32.0 and custom build developer tool is used for all the screenshot in this section. Press F12 key to start this tool.
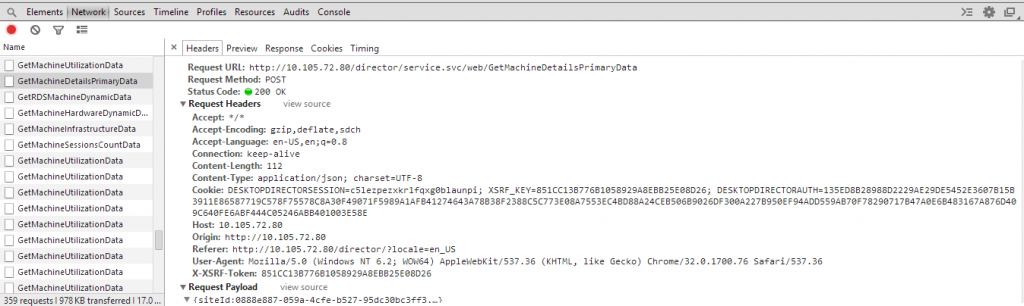
This tool is quite similar to Internet Explorer’s developer tool except some UI changes. It also have eight panels but only Network panel is sufficient for troubleshooting Director like we have in Internet Explorer. Below is the screen shot of that tool with the information a header of call contains.
Below is the screenshot of request body of the call.
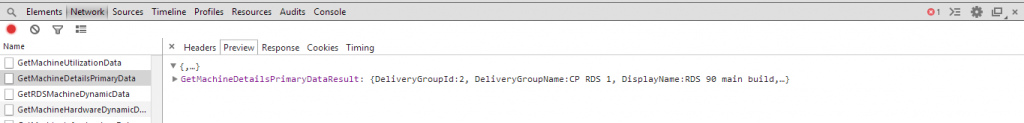
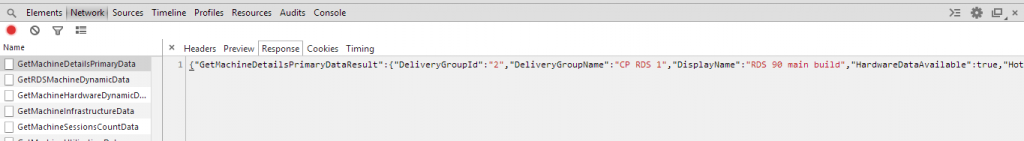
Below is the screenshot of response body of that call.
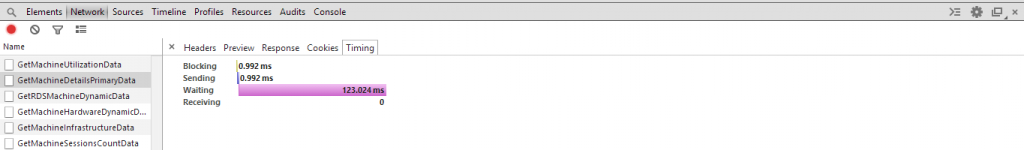
Below is the screen shot of time spent by that call in getting back the result.
Google Chrome also have the same steps of debugging a call failure as we discuss in previous section of Firefox.
All this information can be used to find out what is going on from UI to Backend. If any call fails then one can find out what is wrong by looking into the error code in response of that call. These tools are also helpful to find out if a call gets correct values in response but UI shows some incorrect behavior to the user.
We hope at this point you have a quite understanding of how to troubleshoot Director in Firefox or in Internet Explorer. If you need more information or help then please leave your comment or suggestion we will be happy to hear from you.