Overview
XenDesktop 7.6 now includes machine details in Citrix Director. These details enable IT administrators to get more insight about the machines in use. The machine details page consists of machine utilization, infrastructure details, number of sessions, and hotfix details. With this new addition, the administrators can view machine-level details on the Director console itself.
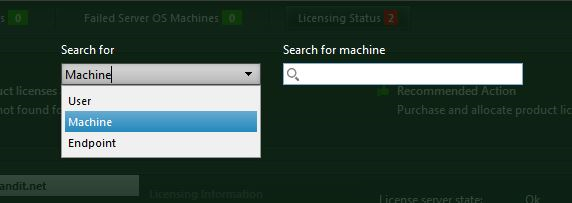
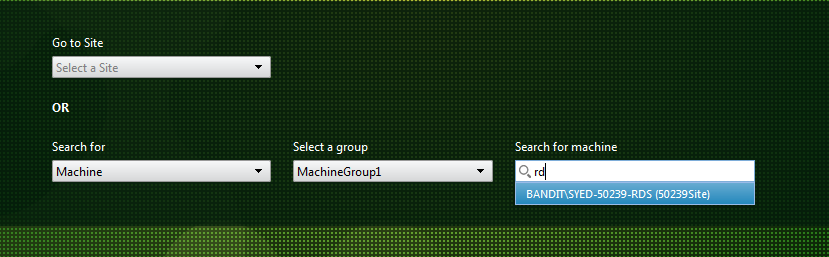
As shown in the screenshot below, after logging into Director, you can now search for a machine directly by selecting “Machine” in the dropdown list on the left and then entering the name of the machine in the “Search for machine” field on the right.
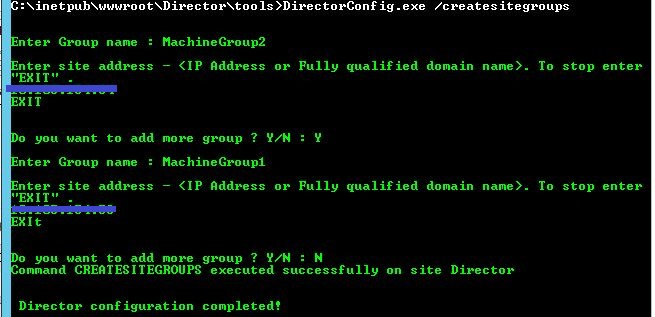
The Director administrator can now configure Site groups as an additional search filter to narrow down results to these specific groups. Create the groups in the Director server by running the configuration tool with the following command prompt:
C:\inetpub\wwwroot\Director\tools\DirectorConfig.exe /createsitegroups
Then provide a Site group name and an IP address of the Site’s Delivery Controller to create the Site group, as shown in the following screenshot:
After the Site groups are created, the administrator can select a group from the newly added “Select a group” field:
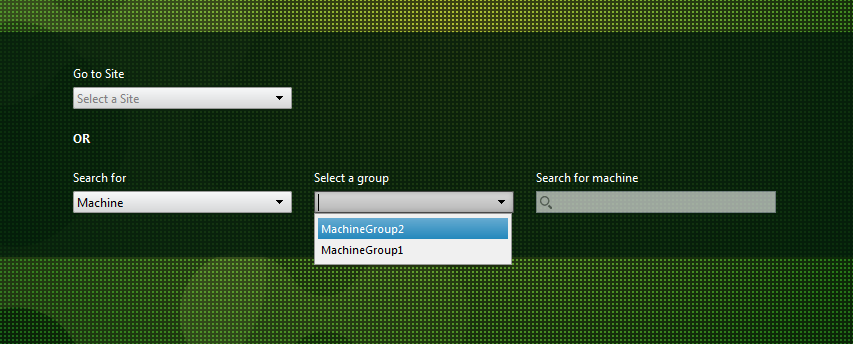
All machines that match the search string entered appear in the “Search for machine” dropdown. Then the administrator can select the appropriate machine to navigate to machine details page.
The machine details page has five sections:
- Machine Details
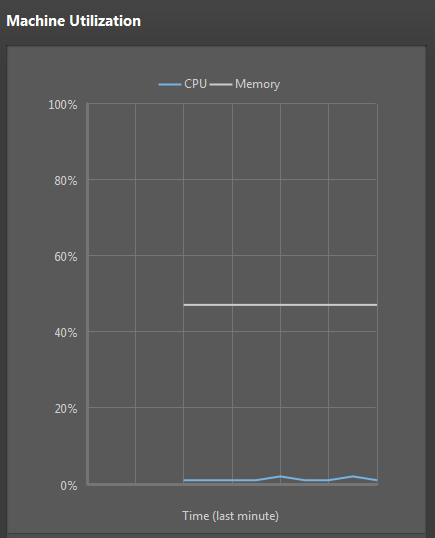
- Machine Utilization – CPU and memory usage
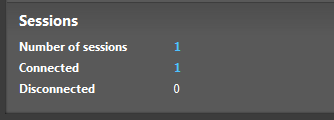
- Sessions – The total number of connected and disconnected sessions
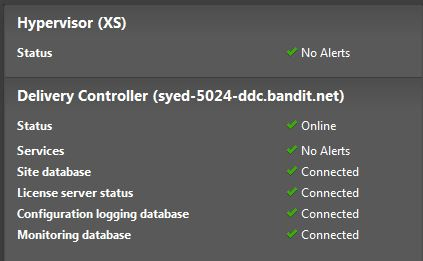
- Infrastructure Panel – Hypervisor and Delivery Controller sections
- Hotfixes
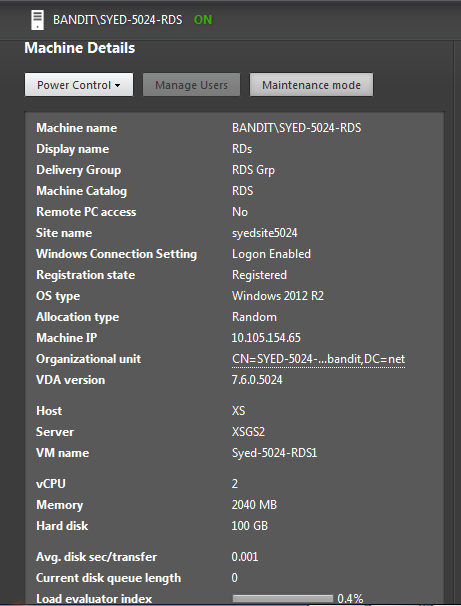
Machine Details
The panel consists of the following fields:
- Machine name: The domain\machine name of the machine selected.
- Display name: The display name of the machine as configured while creating and publishing the Delivery Group.
- Delivery Group: The Delivery Group that contains the machine selected.
- Machine Catalog: The catalog that contains the machine selected.
- Remote PC access: Indicates whether the selected machine is configured for Remote PC Access.
- Site name: The Site name with which the machine is associated.
- Registration state: Indicates whether the machine is registered with the Delivery Controller.
- OS type: Indicates the operating system running on the machine.
- Allocation type: Indicates whether the allocation is static or random.
- Machine IP: Gives the IP address of the machine (Ipv4/Ipv6).
- Organizational unit: Gives the organizational unit with which the machine is associated in Active Directory.
- VDA version: Gives the version of the XenDesktop VDA installed on the machine.
- Host: Indicates the name of the hypervisor host as configured on Studio.
- Server: Indicates the name of the hypervisor as seen on the hypervisor console, such as XenCenter/VSphere/SCVMM console.
- VM name: Indicates the name of the virtual machine as seen on the hypervisor console.
- vCPU: Indicates the number of vCPUs allocated on the hypervisor for the machine.
- Memory: Indicates the memory allocated on the hypervisor for the machine.
- Hard disk: Indicates the hard disk allotted to the machine on the hypervisor.
- Avg. disc sec/transfer: The average time in seconds per every disk transfer as seen on the performance monitor tool on the machine.
- Current disk queue length: The disk queue length as seen on the performance monitor tool on the machine.
- Load evaluator index: This field, which is only present for server OS machines, gives a measure of the load on the server machine distributed across CPU, memory, disk and session count.
The Director admin can perform some additional operations on machine details page:
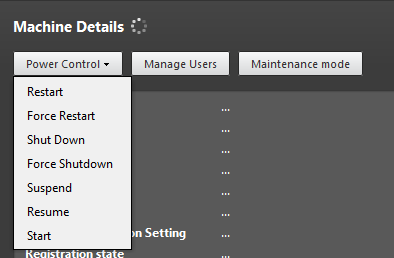
a) Power Control – The Power Control dropdown allows the user to shut down, restart, force restart, force shut down, and start a virtual machine. To perform these power control operations on Remote PC machines, you must configure the XenDesktop Wake on LAN feature.
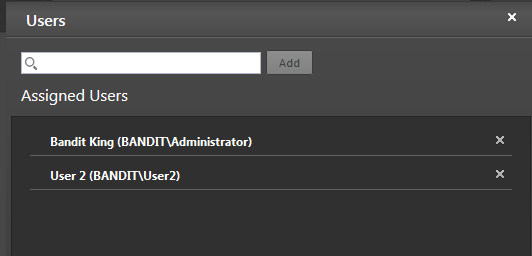
b) Manage Users – You can now assign users to the machine directly from Director console. To do so, click the Manage Users button, which opens up the popup below:
c) Maintenance Mode – You can now set the maintenance mode for the machine from the Director console by clicking on the Maintenance Mode button on the machine details panel. You can turn it off by clicking the same button again.
Machine Utilization
The Machine Utilization panel displays memory and CPU usage over the past minute so IT admins can monitor the load on the machine from the Director console. This enables help desk admins to solve issues related to slow and poor performance in user sessions because of either CPU or memory usage overload. The panel is updated every five seconds.
Sessions
The Sessions panel shows the total number of sessions associated with the machine, including the number of connected and disconnected sessions. The numbers are hyperlinks that redirect to the Filters page.
Infrastructure
The infrastructure is divided into two sections, hypervisor status and Delivery Controller.
Hypervisor Status – The alerts set on the hypervisor host are shown in this section. (Note: Alerts set on HyperV host currently are not supported.)
Delivery Controller – This panel consists of multiple fields that are explained below:
a) Status: Status of the Delivery Controller, either online or offline. For example, the Director server is either unable to reach the Delivery Controller, or the Broker Service on the Delivery Controller is not running.
b) Services: Shows the number of core services that are currently not available, including Citrix AD Identity Service, Broker Service, Central Configuration Service, Hosting Unit Service, Configuration Logging Service, Delegated Administration Service, Machine Creation Services and Monitor Service. Just like the alerts in the Hosts table, the administrator can click the alerts’ text and see a pop up displaying the name of the service, the time the service failed, and the location of that service.
c) Site Database: Indicates whether the site database is connected. For example, the Delivery Controller is unable to contact the Site database; there is an issue with the database configuration; or there is version mismatch between the database and the service.
d) License Server: Indicates whether you can connect to the license server configured for the Site. For example, the Controller is unable to contact the license server; if they are running the same machine then the service may be stopped.
e) Configuration Logging Database: Indicates whether the Configuration Logging Database is connected. For example, the Citrix Configuration Logging Service on the Controller is not running.
Monitoring Database: Indicates whether the Monitoring Services Database is connected. For example, the Delivery Controller is unable to contact the Monitoring Services Database, or the Citrix Monitoring Service on the Controller is not running.
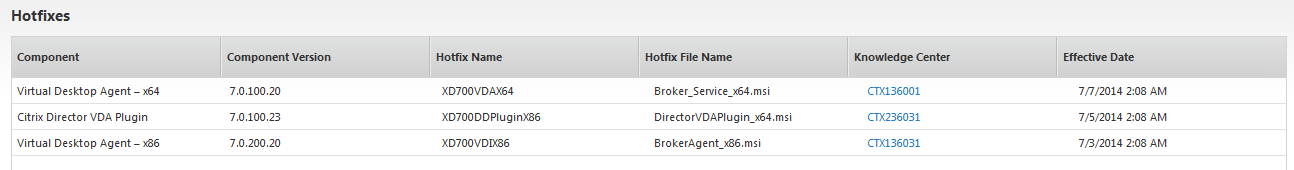
Hotfixes
The Hotfixes panel consists of details pertaining to the hotfixes installed on the machine selected. Details displayed include component, component version, hotfix name, hotfix file name, links to Knowledge Center articles and effective date.