Given today’s rapidly changing digital environment, delivering an exceptional customer experience is a top priority for managing teams in a Citrix environment.
The Citrix Director Machine Details page provides useful information and features to simplify troubleshooting, improve resource utilization, and improve overall performance. In this article, we’ll look at several aspects of content pages that help management teams gain visibility, resolve issues before they arise, and keep Citrix running smoothly.
- Comprehensive Machine Insights:
A summary of device configuration, infrastructure information, and configuration settings is available on the device information page. It enables administrators to make informed decisions with a deeper understanding of the security of their environment and supports Citrix installations by providing a clear overview of the system environment.
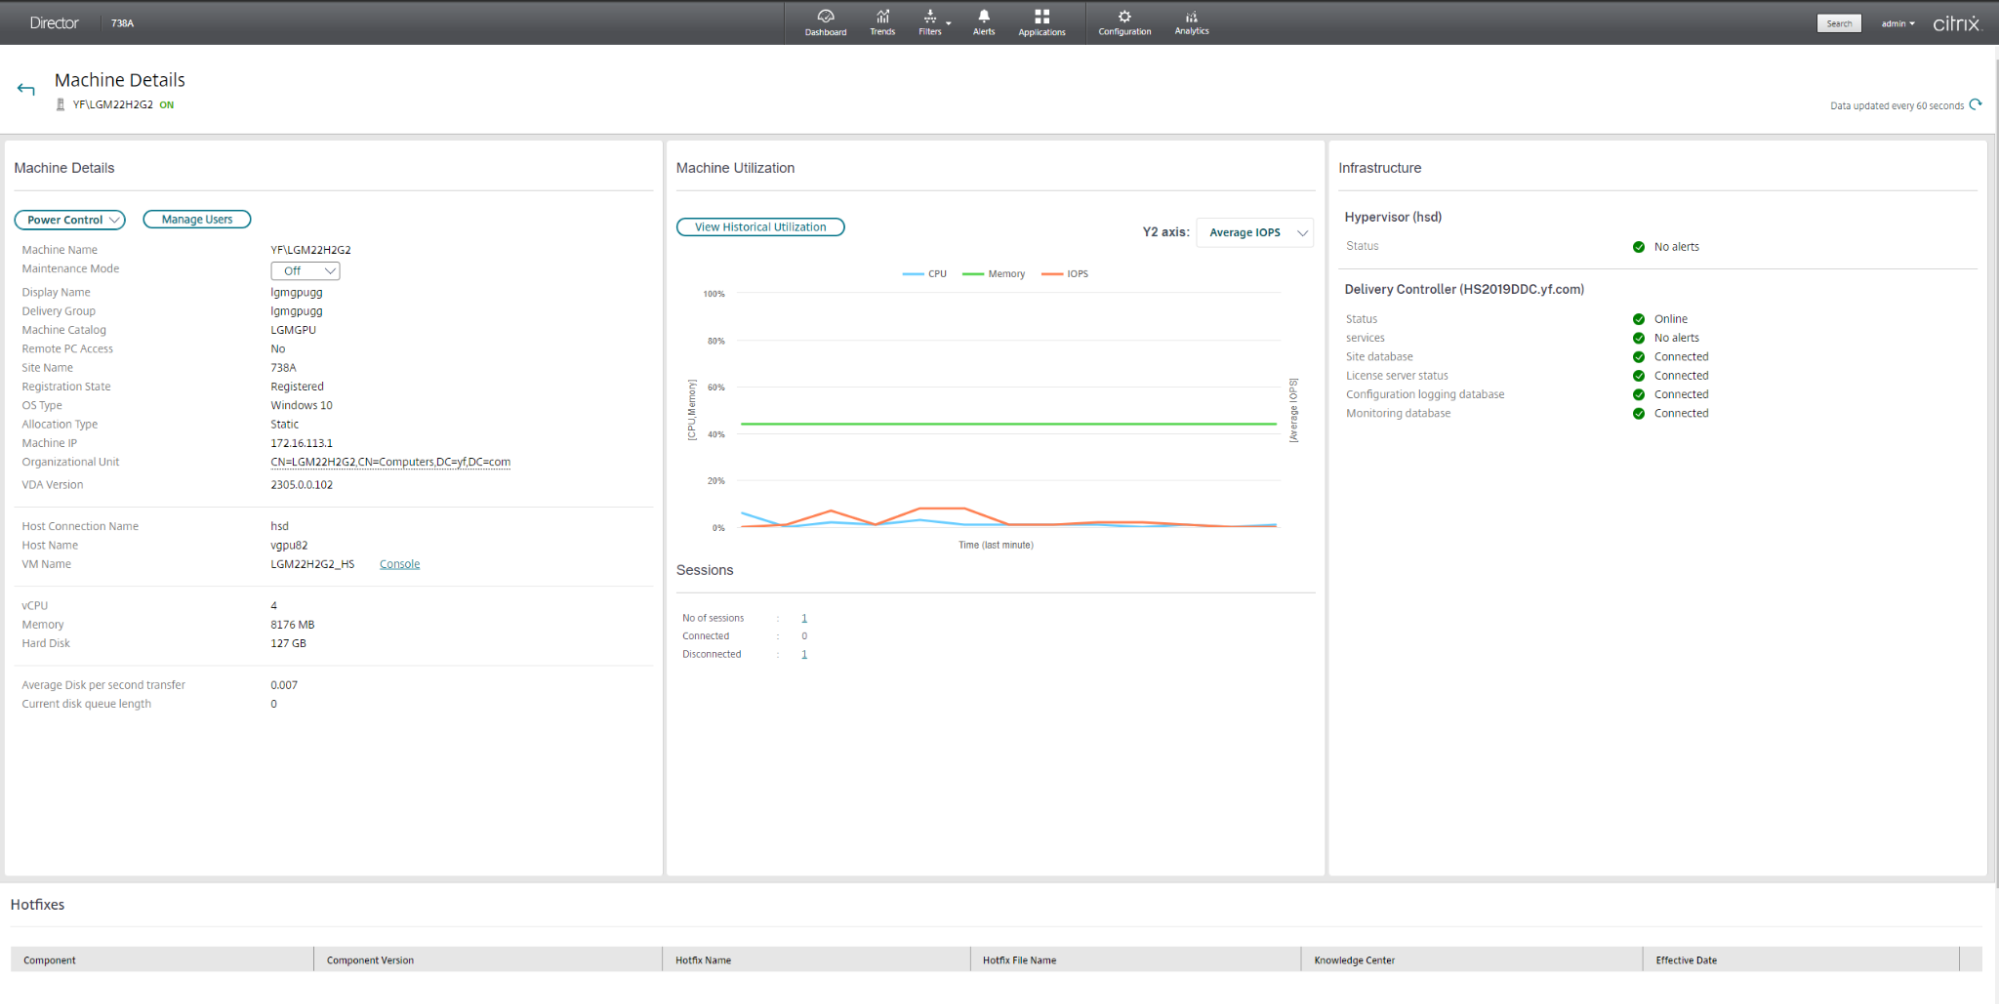
- Real-time Resource Utilization:
Effective monitoring and optimization of resource usage is critical to maintaining peak performance. Administrators can use the dashboard to view current CPU, memory, disk, and GPU usage. This panel uses interactive graphs to intuitively display resource consumption, allowing administrators to spot bottlenecks and recognize performance issues.
– Disk Monitoring: Administrators can monitor disk performance by looking at average IOPS and disk latency graphs. These metrics provide information about read and write operations and the time it takes for the disk to process the requested data. With this knowledge, administrators are better able to troubleshoot disk-related issues and improve storage performance.
– GPU Utilization: The GPU Utilization graph provides useful information about GPU-related issues in environments that use GPU acceleration. This includes the operation of encoders and decoders, as well as GPU memory usage and GPU usage. Administrators can use this information to identify potential GPU bottlenecks and optimize GPU allocation to improve performance.

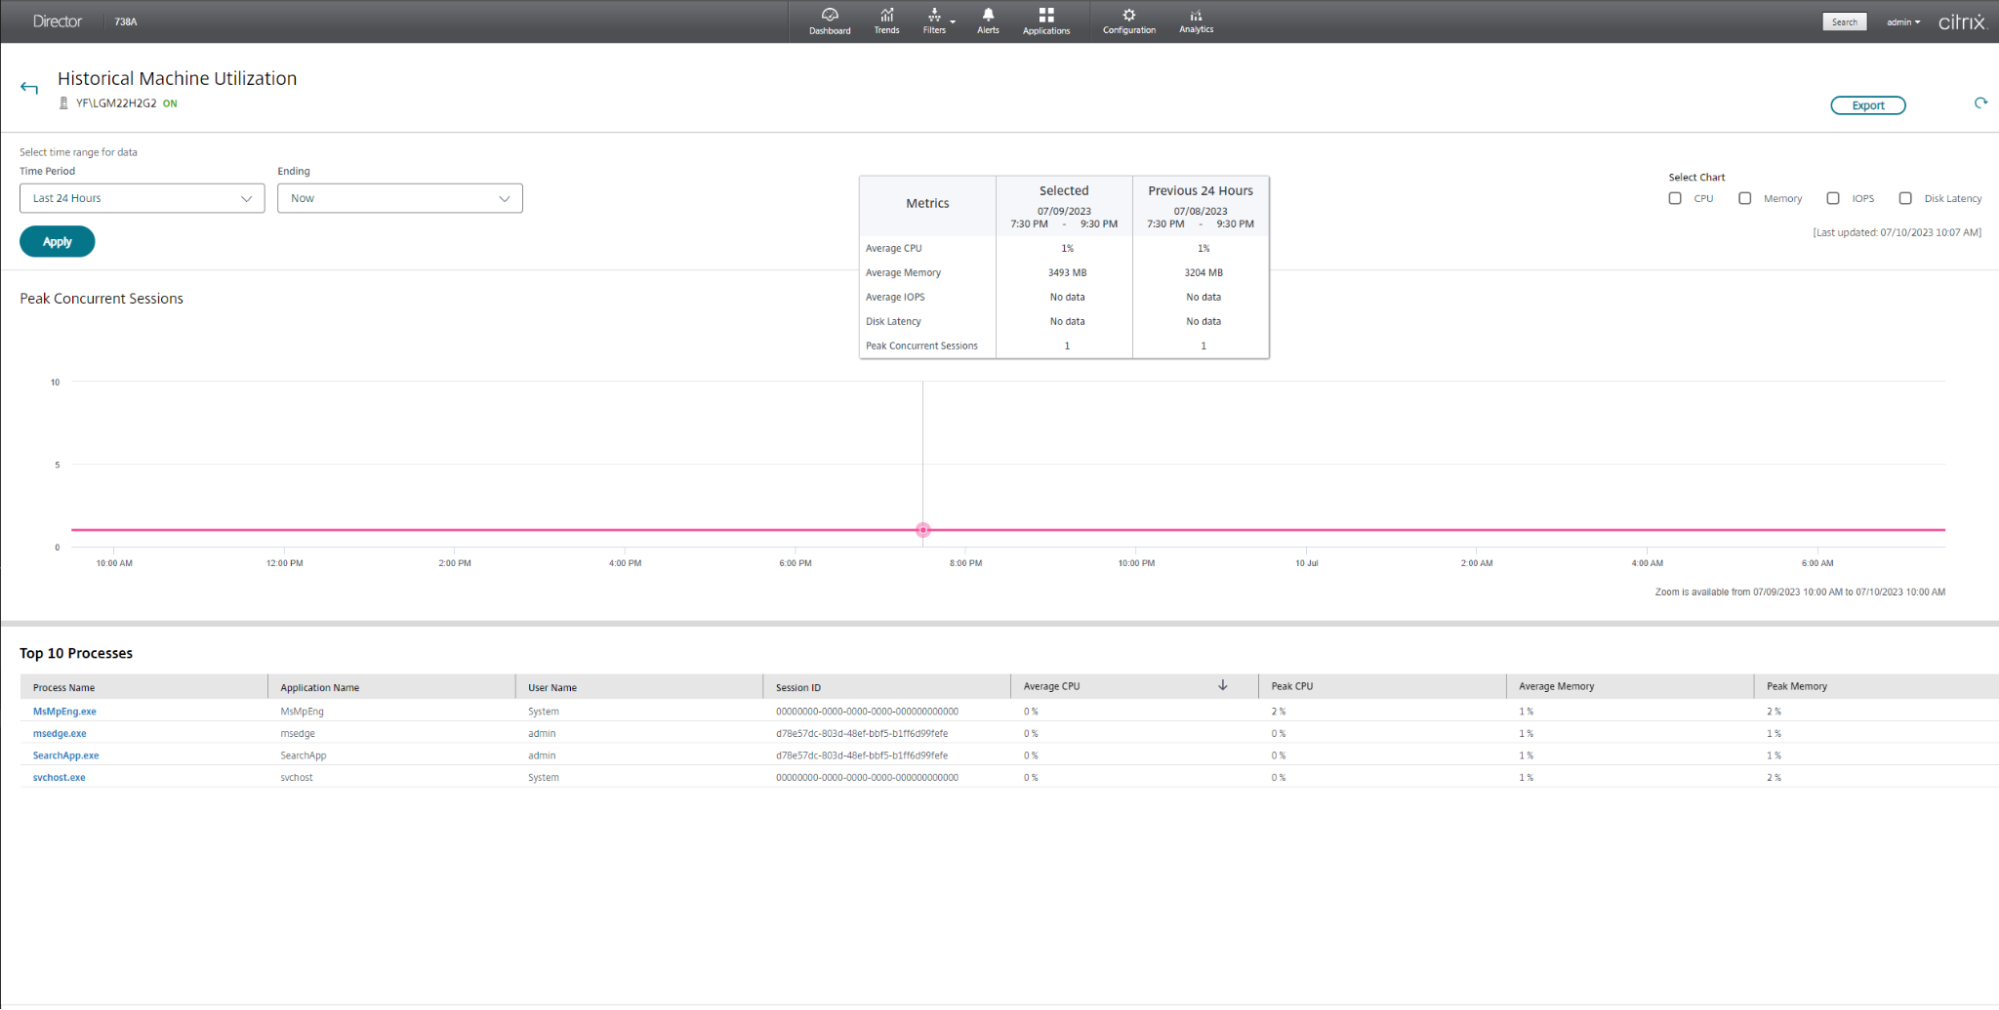
- Historical Resource Utilization:
By providing historical usage data, the content page crosses the monitoring period. To check the status and trends of CPU, memory, maximum shared capacity, disk IOPS, and disk latency, administrators can select a specific time period. This historical perspective facilitates planning, resource development and identification of long-term uses.
– Top 10 Processes: The top 10 processes by CPU or memory usage are also listed in a table on the machine details page. This feature lets citrix administrators know what programs or processes are being used, to ensure effective problem solving and effective resource management.
- Infrastructure Panel:
The Infrastructure panel on the Summary page provides administrators with important information about the health status of their infrastructure. The Host and the Delivery Manager are two parties:
– Host: This section describes the nature of hypervisors configured to host virtual machines in a Citrix environment. It also displays all alerts triggered by this monitor, including disk, CPU, memory, and network usage alerts. The host on which the alert was generated is additional information that administrators can view by clicking on the alert..
– Delivery Controller: Administrators can check the status of Delivery Manager and the services running on it in this section. Provides details on essential service availability, database connection, license server connection, database access configuration, database connection management, and delivery in online or offline. Clicking on alerts provides additional details about the failed services.

- Streamlined Troubleshooting:
The page shows the machine, gives all the reasons for the failure, and recommends the machine and connection failure for easy troubleshooting. Administrators can click on the Failure Cause column of the system failure to access the failure description and step-by-step instructions for effective troubleshooting.
This simple method reduces time, speeds up problem resolution and improves user experience.

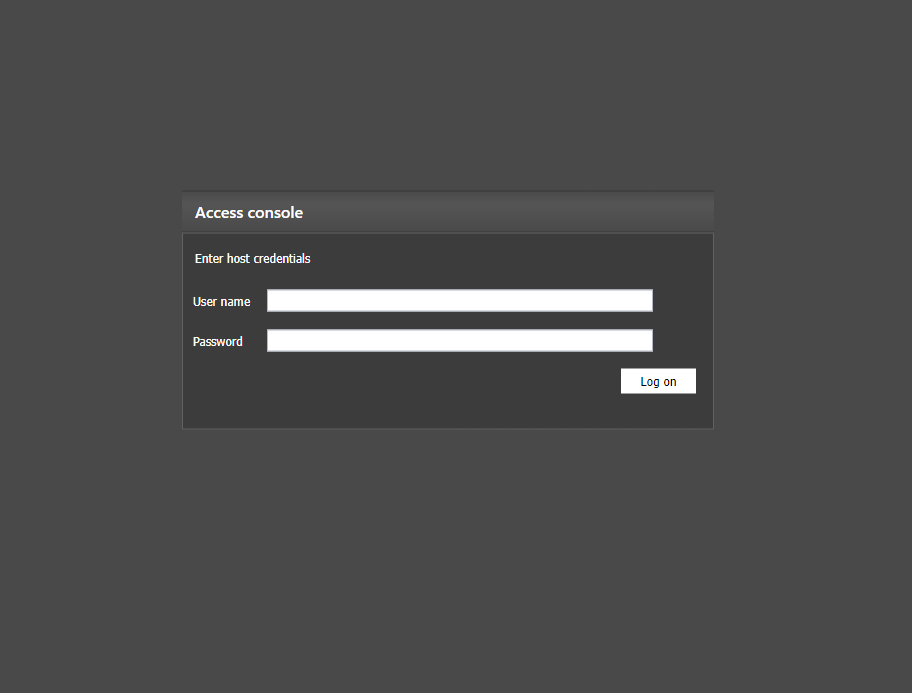
- Direct Machine Console Access:
Direct access to single and multi-session OS machine consoles hosted on XenServer version 7.3 and later is provided through the Citrix Administrator machine details page, eliminating the need for outside tools. By allowing managers to resolve issues directly within Manager, this feature increases efficiency and reduces reliance on external tools.
Conclusion:
Citrix Director’s Machine Details page provides service administrators with powerful tools to monitor, troubleshoot, and improve performance in their Citrix environments. Leverage real-time usage data and usage history, building health insights, easy troubleshooting, and tools directly into the console, administrators can proactively address issues, enhance performance, and deliver an exceptional user experience.
For more Information on Machine Details Page, consult the Citrix Product Documentation: Troubleshoot Machines.
Disclaimer: The development, release and timing of any features or functionality described for our products remains at our sole discretion and are subject to change without notice or consultation. The information provided is for informational purposes only and is not a commitment, promise or legal obligation to deliver any material, code or functionality and should not be relied upon in making purchasing decisions or incorporated into any contract.