


Introducing new HDX graphics performance counters
There are a variety of ways to get insights and information about your Citrix session and HDX graphics in particular. Citrix provides tools like the graphics Status Indicator, HDX monitor and Citrix Director and Analytics that can be used to monitor, troubleshoot and triage HDX graphics-related issues. Performance metrics and statistics related to HDX are exposed via Performance counters and are available in Windows Performance Monitor. In this blog, I’ll dive a bit deeper into the new Performance counters that we’ve added to the product and show you examples of how you can use these counters to troubleshoot two common issues.
Graphics status indicator
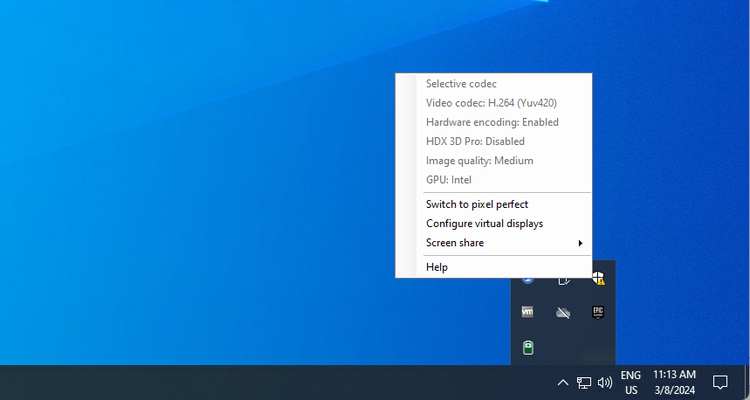
For in-session information, we have the graphics status indicator.
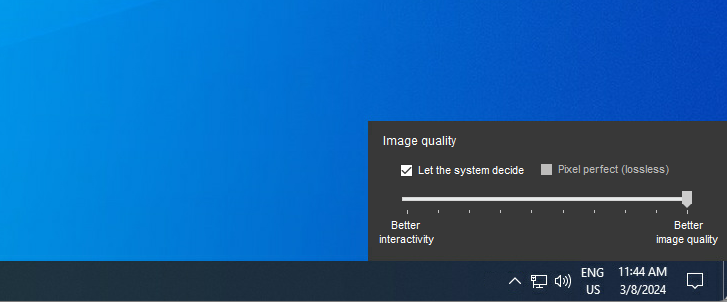
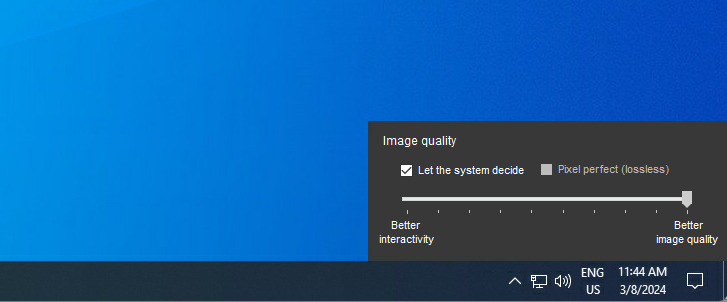
This tool lets the end user see information about the active graphics mode currently being used. The information includes details about video codec, hardware encoding, image quality, and monitors in use for the session. With the graphics status indicator, the end user can also enable or disable pixel-perfect mode and allows for the end user to find the right balance between image quality and interactivity.

HDX Monitor
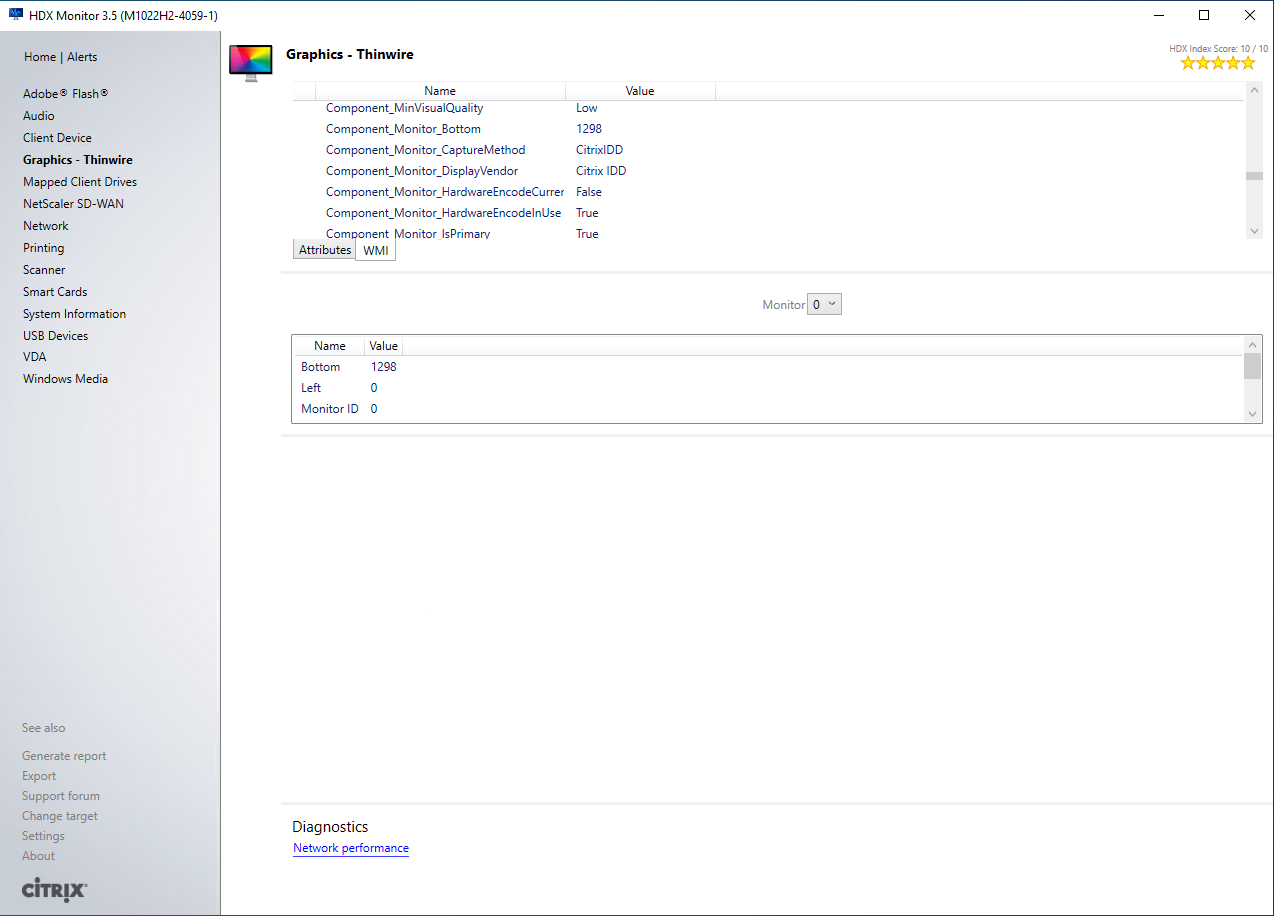
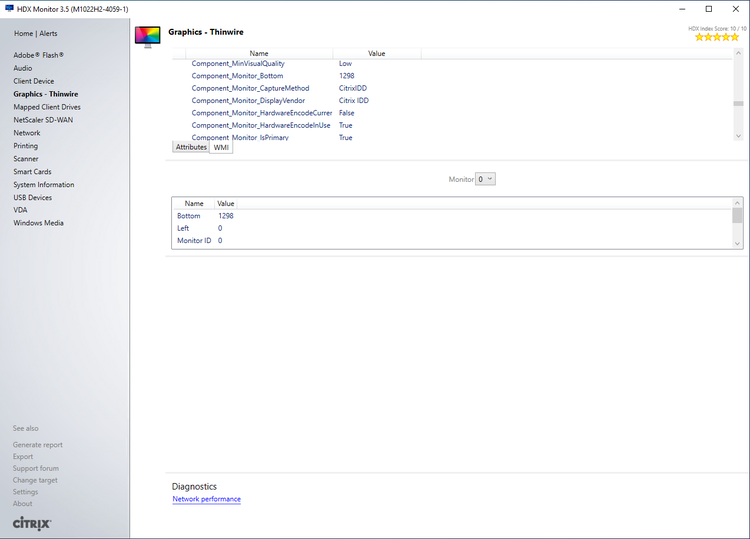
The HDX Monitor tool is used to validate the operation and configuration of key HDX features like Thinwire graphics. HDX monitor is more geared towards monitoring and diagnostic than the Graphics status indicator and shows much more information about the session. HDX monitor also includes tabs to view the available WMI output for HDX. HDX monitor fetches this information from preinstalled Windows WMI objects and Citrix-specific WMI providers installed during VDA installation.
WMI Objects
The information in the WMI Objects can also be queried directly. The Citrix also exposes Windows Management Instrumentation (WMI) information under the Citrix namespace Root\citrix. Information about HDX is available under root\citrix\HDX.
To query the WMI Objects WMIC can be used as well as PowerShell.
To view a list of available objects and classes, open Powershell and execute the following CmdLet:
Get-WmiObject -Namespace root/citrix/hdx -Query “SELECT * FROM Citrix_VirtualChannel_Thinwire_Base”
Citrix Analytics
You can also leverage our Analytics platform for in-depth analysis of the session performance and user experience. User Experience Analytics analyses user sessions based on important parameters that define their performance – Session Logon Duration, Session Responsiveness, Session Availability, and Session Resiliency. Session responsiveness, for example, measures in-session responsiveness and session latency.
Performance counters
In CVAD 2308, for HDX Graphics we significantly increased the number of performance counters that are available specific to graphics encoding and can be found in “ICA Graphics”. The counters in “ICA Session” are specific to the rest of the protocol stack and transport layer.
The following table lists the available “ICA Graphics” counters. Unless otherwise stated, each counter is updated every 10 seconds.
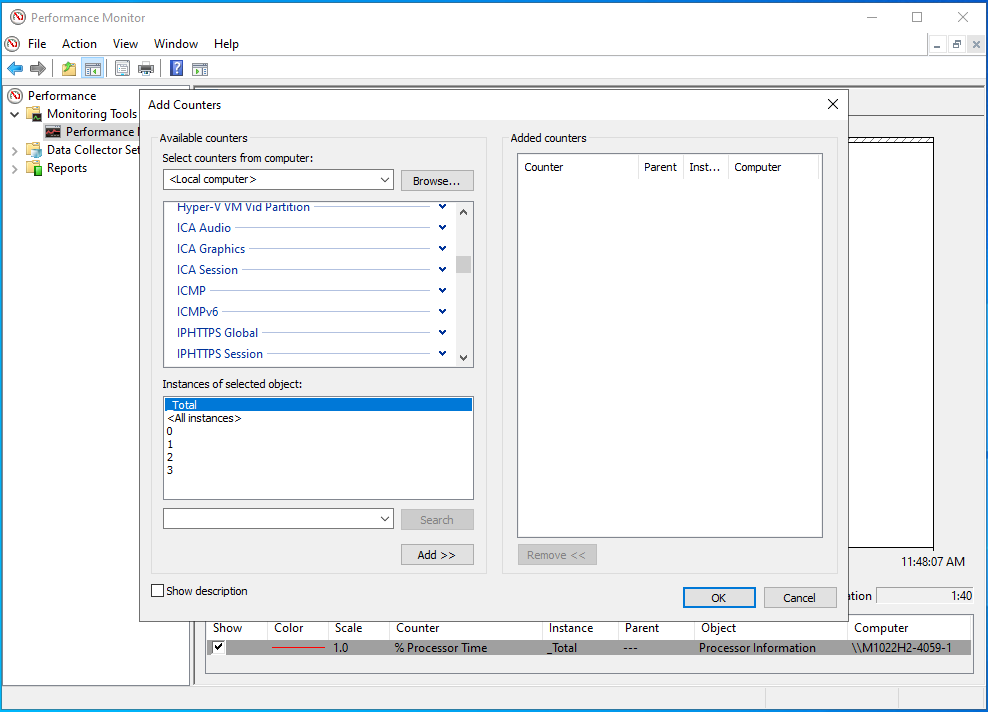
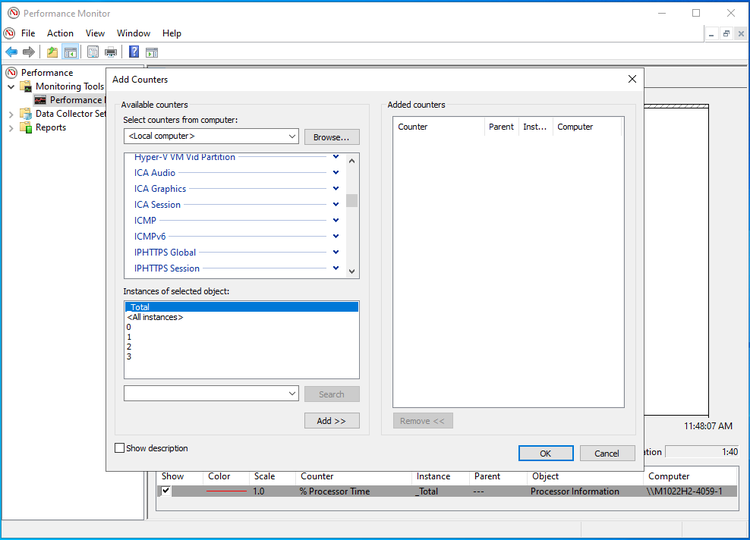
The performance counters can be viewed using PerfMon. Perfmon primary use is intended for viewing real time statistics. When perfmon is first started only the %Processor Time counter is visible. Additional counters can be added by clicking on the green plus sign. The HDX graphics counters are available under the ICA Graphics:
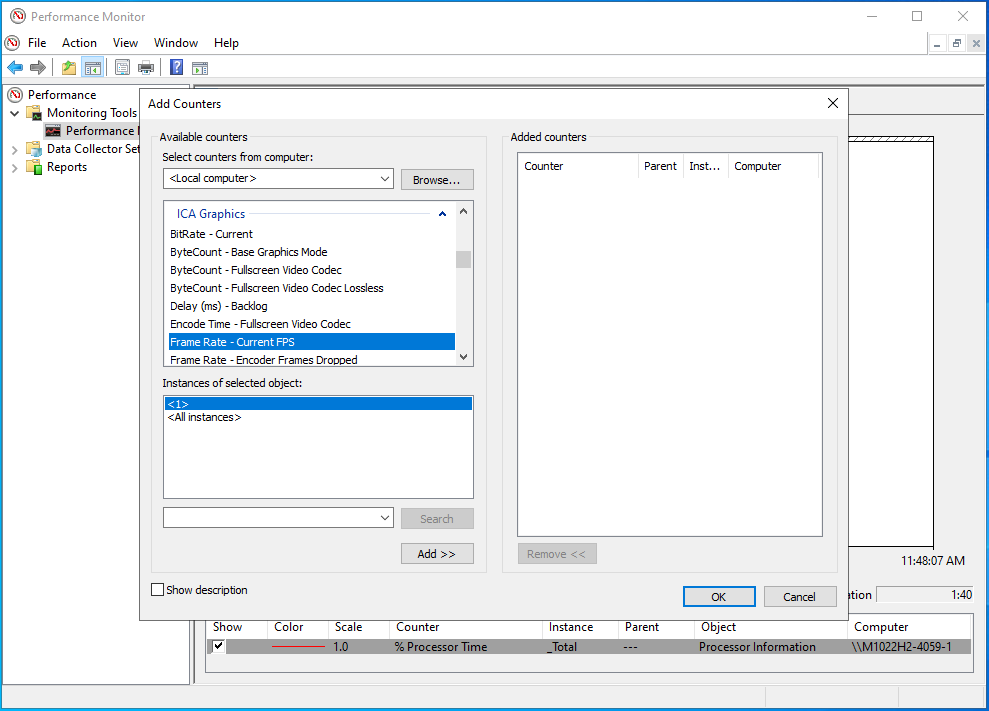
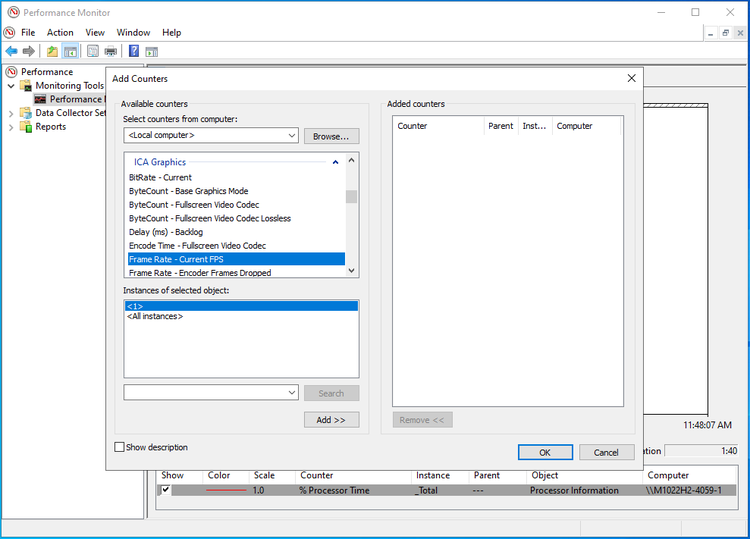
Added counters are immediately displayed in the real-time statistics overview.
Besides viewing the real-time statistics, the Windows Performance Monitor can be used to capture the performance metrics over time by creating Data Collector Sets.
All of the counters that are available can also be used in these Data Collector Sets. Data Collector Sets can be configured with specific performance counters and custom alerts based on your specific needs and criteria. When configuring custom Data Collector Sets you will be able to specify the sample interval, for example, and where the data collected will be saved. The data collection for these Data Collector Sets can be run manually or can be scheduled to run at specific times or periodes.
Citrix recently acquired Vast Limits GmbH, the German-based company behind uberAgent. All Citrix performance counters can also be easily integrated into uberAgent.
For more information on how to query performance counters in uberAgent, please see the practice guide.
Use cases
With the performance counters, you can, for example, monitor the frame rate and average frame rates of running Citrix Session.
The ICA graphics counters are focused on the encoding part of HDX. These metrics can be combined with the metrics from the ICA Session list of counters to show correlations between the data points or troubleshoot issues.
For a metric or counter to hold any value, it should answer a question that supports you in achieving a goal, whether to diagnose or troubleshoot a problem or gain insights into how the session is performing, for example. To illustrate this, we’ll show two examples of how you can leverage the ICA Graphics performance counters.
In the example below, we will add the frame rate and average frame rate performance counter.
In this example, we’ve added the current frame rate counter. As we can see, if there are no screen changes, the FPS will drop to a couple of FPS. When we move the Performance Monitor windows, due to the screen updates this creates, the frame rate will increase.
When we play a 60 FPS YouTube video, thinwire will match the output to 60 FPS as well, and when we switch the video from 60 fps to the default, we will drop back to 30 FPS. Here we can combine the input FPS and Output FPS metrics to determine if there are performance issues. Ideally speaking, we want to match the output FPS to the input FPS. The input FPS metric shows the amount of frames per second our encoding engine is getting from Windows. If there is a large discrepancy between the input FPS that the encoder is getting and the output FPS that it is generating, this could signify a performance issue within the VDA.
Another example is that we can monitor the static image quality with the counter ‘Thinwire JPEG Image Quality’. This will show us a real-time number for the static image quality. We can influence the static image quality with the Graphic Status Indicator. If we change the quality from the default ‘let the system decide’ to a manual setting, we can observe that the ‘Thinwire JPEG Image Quality’ will change accordingly in real-time. Lowering the quality all the way down will introduce a very apparent visual degradation.
To learn more about our graphics features and new enhancements we made to HDX Graphics, be sure to check the product documentation at Citrix Virtual Apps and Desktops and our Techzone HDX Graphics Overview article: Design Decision: HDX Graphics Overview | Citrix Tech Zone
Disclaimer: This publication may include references to the planned testing, release and/or availability of Cloud Software Group, Inc. products and services. The information provided in this publication is for informational purposes only, its contents are subject to change without notice, and it should not be relied on in making a purchasing decision. The information is not a commitment, promise or legal obligation to deliver any material, code, or functionality. The development, release, and timing of any features or functionality described for products remains at the sole discretion of Cloud Software Group, Inc.