


Optimize user experience and diagnose session issues with Citrix Analytics Session Details View
Managing and monitoring Citrix Virtual Apps and Desktops (CVAD) & Citrix Desktop as a Service (DaaS) environments requires a deep understanding of session related parameters to ensure a seamless user experience. The Session Details view in Citrix Analytics provides Citrix administrators with valuable insights for troubleshooting and monitoring important session metrics.
In this article, we will explore the Session Details view, its capabilities, and how it can be leveraged to optimize session performance and identify issues.
Session Details View
The Session Details view offers a comprehensive overview of a selected Citrix session, covering its entire lifecycle from launch to end. This view enables administrators to identify factors that influence a session’s performance and make informed decisions to effectively troubleshoot any issues that may arise.
The details available on the Session Details view can be categorized into two buckets:
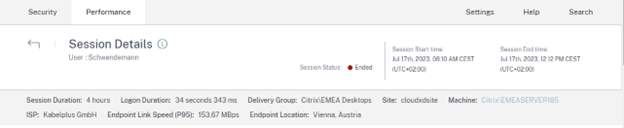
1. Session Descriptors – These can be used to identify a session and provide static details; these include the following:
-
- Session duration
- Logon duration
- Delivery group name
- Site name
- Machine name
- ISP
- Endpoint link speed
- Endpoint location
- Session current status
- Session start time
- Session end time
2. Session Performance Indicators – These metrics are presented as aggregates for the entire session duration, offering valuable insights into the overall impact on a session. Furthermore, the metrics are plotted over time, facilitating detailed analysis of specific time periods within a session’s lifetime.
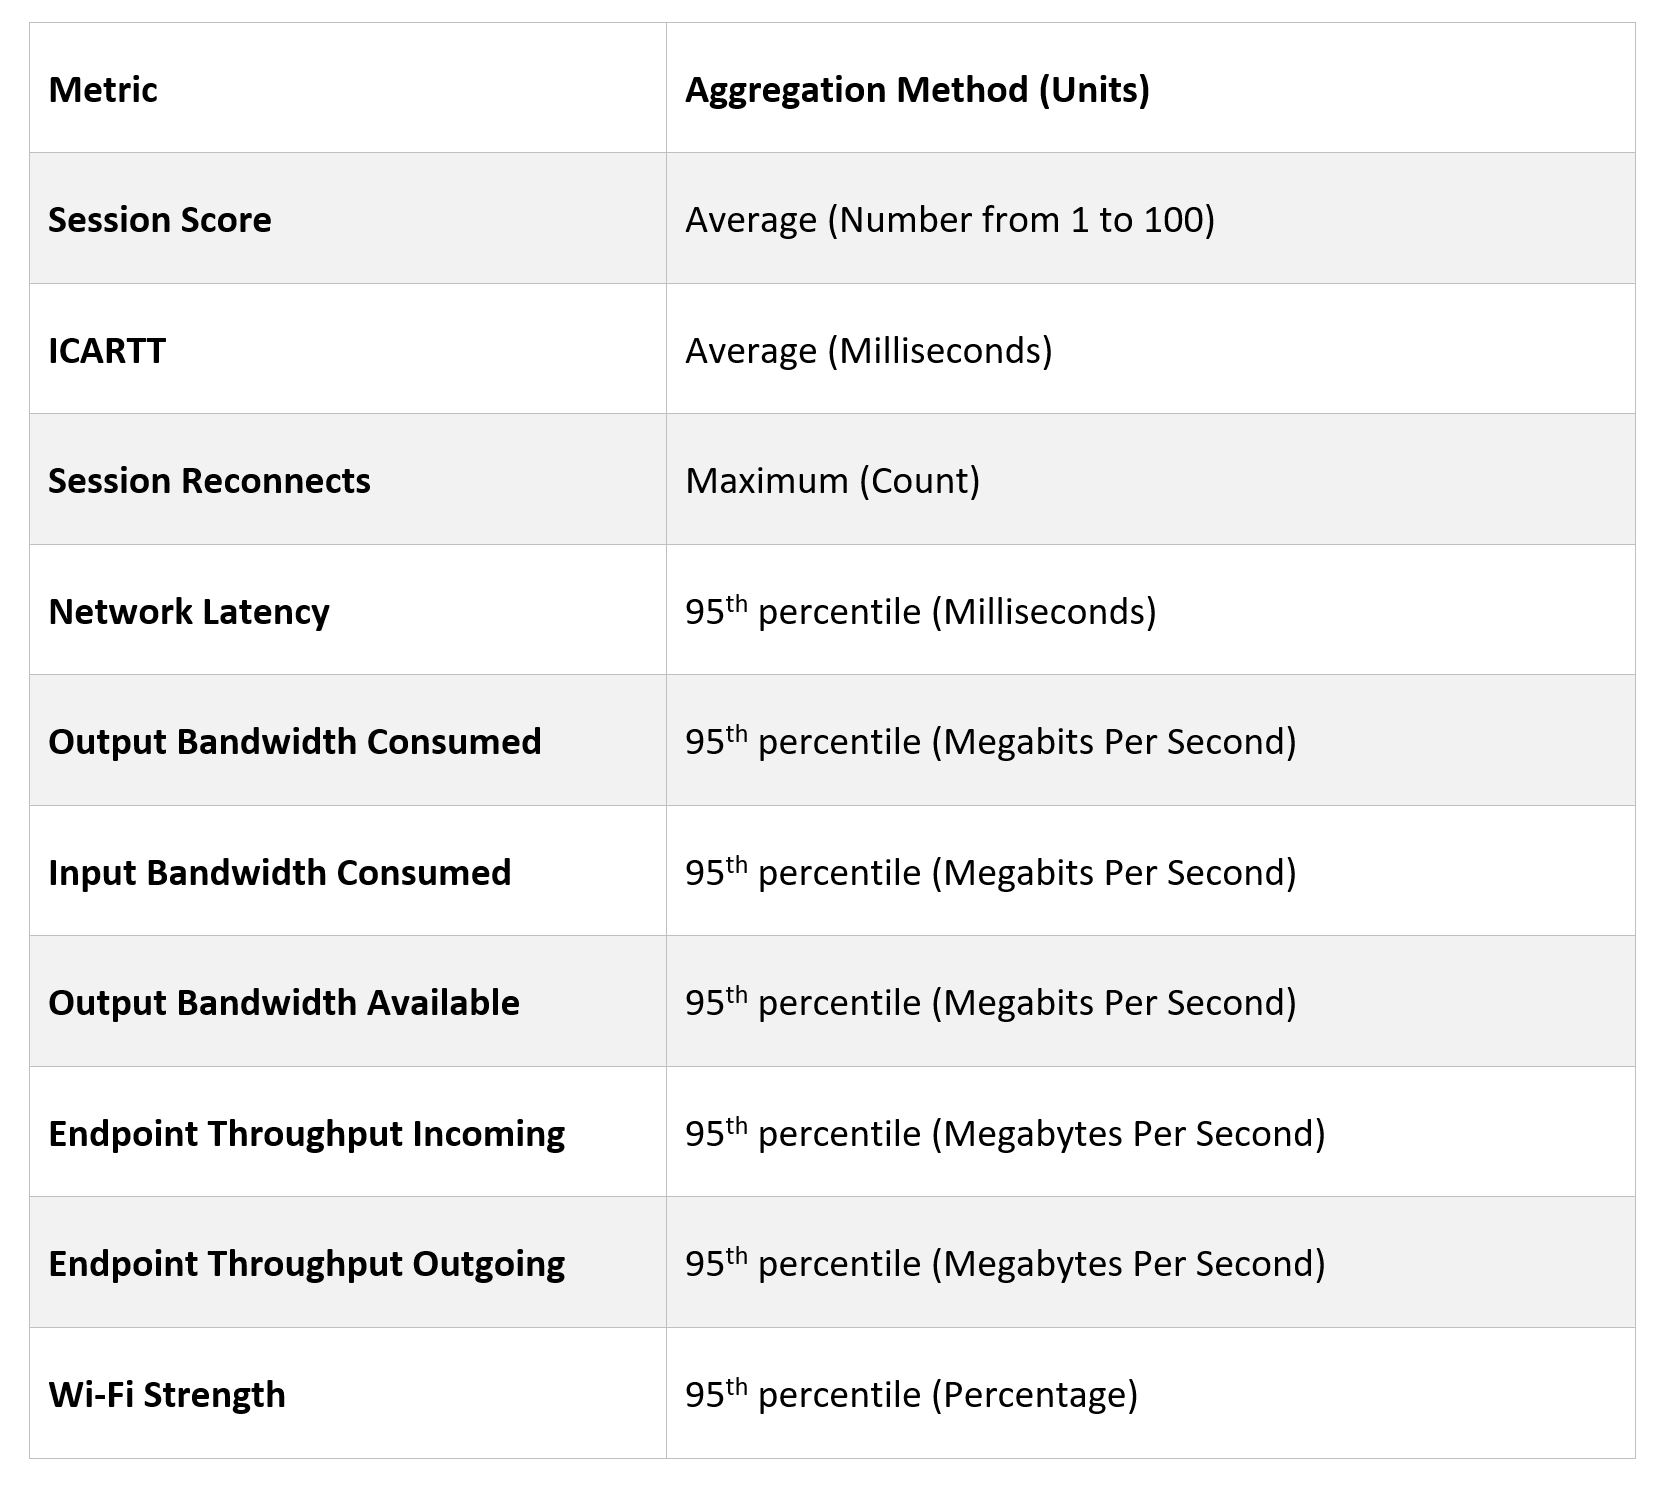
The table below lists the aggregation functions used for each of the metrics and units used for representation:

Let’s explore the details available under both categories and how admins can use them to easily identify and fix issues.
Session Descriptors
Within the Session Details view, administrators can access crucial session parameters that provide a deeper view into the session’s environment. These can be used to better understand the impact that factors like Internet Service Providers (ISPs), Location or Endpoint details may have on a session and relate them to the Citrix deployment using parameters like the Delivery Group, Site and Machine details.
Here is a list of all the information provided:
- Session Duration: The session duration represents the total lifetime for which the user session existed on a specific VDI.
- Logon Duration: Logon Duration is the period from when a user clicks an application or a desktop in the Citrix Workspace App to the instant the app or desktop is available for use. The logon duration includes the time taken for various processes in the complex launch sequence. Total logon time includes phases such as Brokering, VM Start, HDX Connection, Authentication, Profile Load, Logon Script, GPO, and Shell Launch.
- Delivery Group: This is the name of the delivery group providing the selected published application or published desktop.
- Site Name: This is the name of the Citrix deployment hosting the core Citrix resources used to serve sessions.
- Machine Name: This is the name of the Citrix VDI or session host providing the user’s session.
- ISP: This is the name of the Internet Service Provider used by the user to connect to the Citrix deployment and launch sessions. Based on the public IP used to connect to the internet the ISP will be identified.
- Endpoint Link Speed: The endpoint link speed is the maximum bandwidth supported by the user’s device used to launch sessions.
- Endpoint Location: The endpoint location is the physical location of the endpoint, located by resolving the public IP of the user’s client device.
- Session Current Status: This is the current state of a session and depicts if it is currently active or has ended.
- Session Start Time: This is the timestamp when a session was launched by the user.
- Session End Time: This is the timestamp when a session was terminated by the user.
Session Performance Indicators
The Session Details view also presents the following essential metrics to thoroughly evaluate session performance:
- Session Score:The session score is an overall measure of a session’s performance. It represents the quality of a user’s experience and is calculated based on factors such as logon duration, session responsiveness, availability, and resilience. Admins can gain visibility into periods of excellent, fair, or poor performance by analyzing the score throughout a session’s lifetime.
- Network Latency: Network latency is the time delay experienced while transmitting data over the network connection. A higher latency may indicate a poor internet connection or non-optimal geographical routing and can impact a session’s performance.
- ICA Round Trip Time (ICARTT): ICARTT is the time interval between a user’s action and the graphical response displayed on their screen. This considers the delay caused by network latency as well as the time taken for processing, which is dependent on the performance of the application being used. ICARTT is an indicator for session responsiveness, with a higher value indicating a sluggish experience for users.
- Session Reconnects: Whenever a user’s session gets unintentionally disconnected the auto client reconnect feature automatically establishes a connection and reconnects the impacted session. Session reconnects is the number of times a session was automatically reconnected; admins can monitor this to detect any network issues causing disruptions.
- Output Bandwidth Consumption: This is the amount of data being transmitted from the Citrix VDI to the user’s device to display sessions to users and support any other interaction channels like audio.
- Input Bandwidth Consumption: This is the amount of data being transmitted from the user’s device to Citrix VDI to transmit the user’s inputs to sessions.
- Output Bandwidth Available: This is a measure of the total bandwidth available to transmit data from the Citrix VDI to the user’s device. Analyzing output bandwidth available and the output bandwidth consumed can help admins determine if sufficient bandwidth is available for serving sessions and detect if a session is being throttled due to insufficient bandwidth.
- Endpoint Throughput Incoming: This is the rate at which data is being received by the user’s device from the network. Throughput can be used as a measure of congestion on the device’s network interface and admins can monitor it to ensure sufficient throughput is available for Citrix sessions.
- Endpoint Throughput Outgoing: This is the rate at which data is being transmitted by the user’s device over the network. Throughput can be used a measure of congestion on the device’s network interface and admins can monitor it to ensure sufficient throughput is available for Citrix sessions.
- Wi-Fi Strength: Wi-Fi Strength is the signal strength of the Wi-Fi connection on the user’s device. Admins can use this to detect weak internet connections and determine if session performance is degraded due to network issues.
Resolving Session Responsiveness issues using the Session Details View
How the session detail’s view can be used to identify factors causing poor session performance can be better demonstrated with the help of an example.
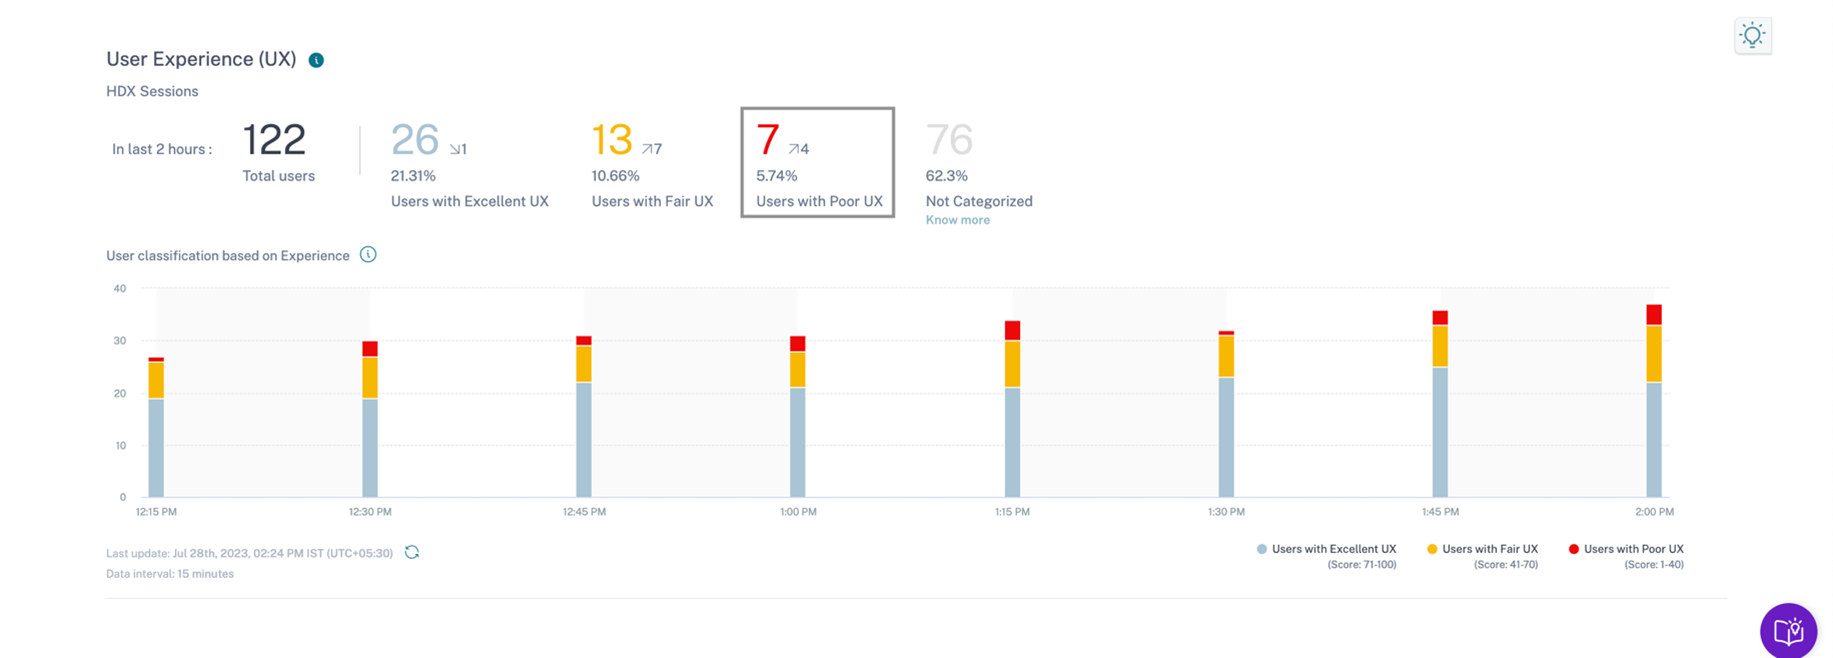
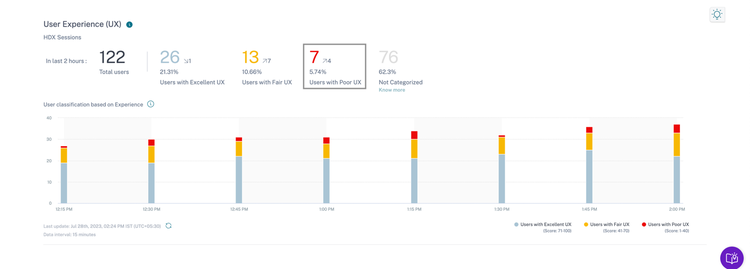
1. The main dashboard of Citrix Analytics for Performance categorizes the User Experience (UX) score of users into three main categories. Clicking on the red number of “Users with Poor UX” – 7 in this example – navigates to the Drilldown page for a guided root cause analysis.
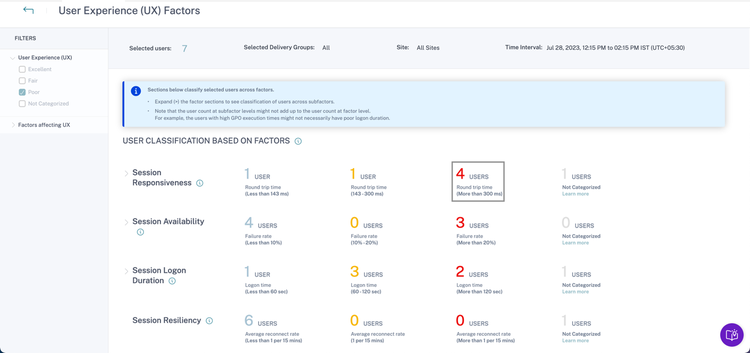
2. The Drilldown page now further classifies the selected users based on factors impacting the User Experience. From the classification, factors impacting these users can be investigated. In the example below clicking on the number 4 of the classification “Session Responsiveness” will select users experiencing round trip time with more than 300ms.

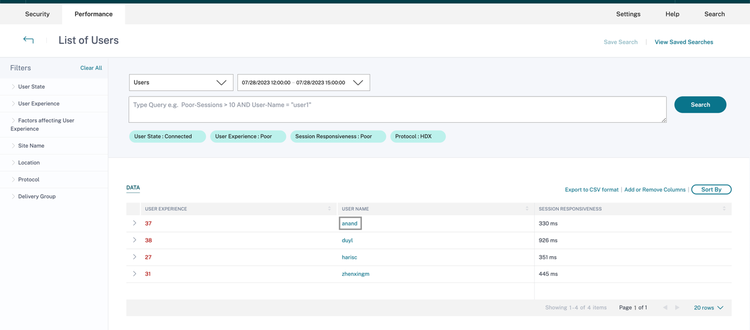
3. The Self-Service search view for users provides more details of the impacted users, and calculates an average score for all the sessions a user had in the selected time span. Clicking on the user’s name will open the Self-Service search view for a breakdown of those Sessions. For a quick view this page also offers a summary of the metrics by clicking on the arrow next to the individual User Experience score.

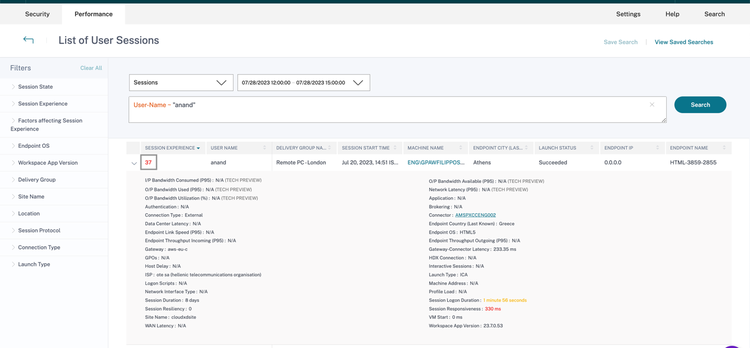
4. This Self-Service view for sessions contains details about all the sessions of the selected user in the given time interval Admins can expand the session row to quickly review details view like ISP and Bandwidth not selected in the tabular view. Clicking on the User Experience number will navigate to the Session Details view – In this example the Session Experience score 37 will navigate to the session details page for the selected session.

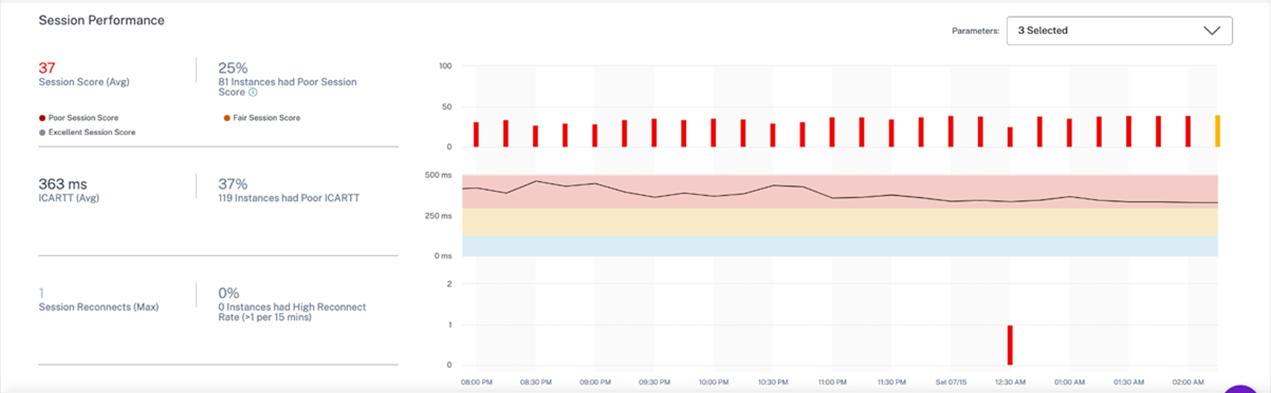
5. The Session Details view visualizes important metrics impacting session performance and provides the ability to review them over the session lifetime. Looking into the details for the selected session it is seen that for 16% of its lifetime this session had a poor session score. Side note: this view is directly accessible via Citrix DaaS Monitor Session Detail view by clicking the “Session Timeline View” button.

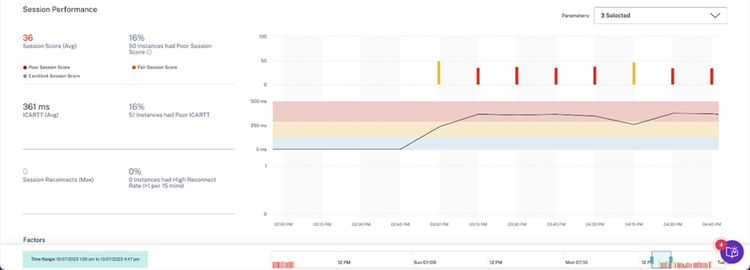
6. Having a look at the ICARTT reveals that the duration of poor user experience coincides with high ICARTT values, which will cause a lag in the user interaction.
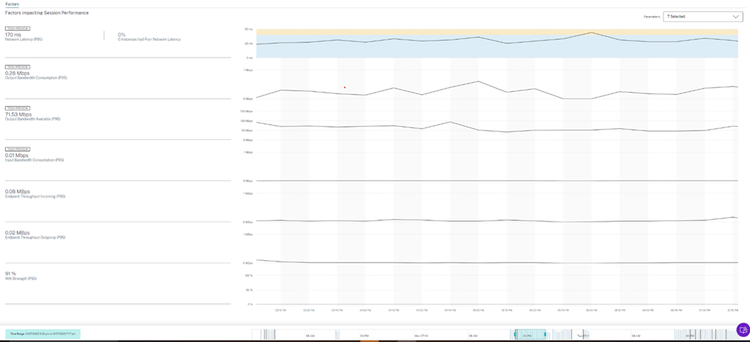
7. The cause of high ICARTT values can be determined by looking into other factors like latency, bandwidth, and signal strength. In this case, the network latency value is high for 93% of the session lifetime. As latency is a major contributor to ICARTT and is attributed to factors like the users network and VPN being used, working with user’s to resolve latency issues will help improve experience.

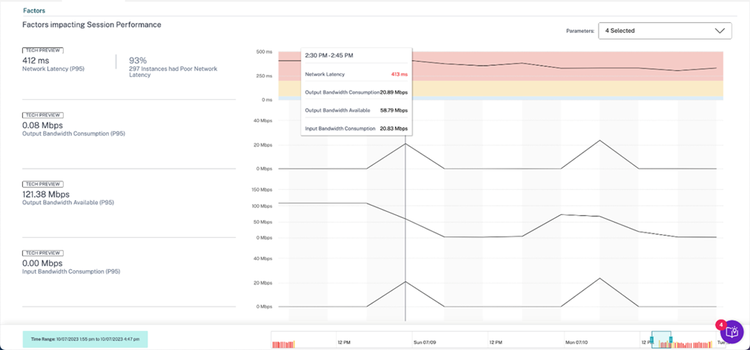
8. Furthermore in chart above, the Bandwidth Available is seen to drop to very low values for certain intervals, this will throttle the users connection and disrupt the session. A possible next step in this case should be to investigate the network for issues like outdated drivers, excessive load or other any known performance degradations.
9. Having a look Wi-Fi signal strength also reveals a weak connection, which will impact performance.


The above analysis helps identify session performance issues and the underlying factors, making it easier for admins to resolve them.
Using the factors identified above, the following steps can be taken to improve the performance:
- To improve the network latency, check the ISP for unwanted VPN or Secure Edge Proxy services, admins can further check if the Gateway PoP being used is the most optimal, based on endpoint location. Also monitoring for any ongoing issues on the network, such as high latency caused by WiFi or LTE network usage, or WiFi signal strength can be helpful.
- Users need to that proper bandwidth is available at the endpoint, meeting the minimum bandwidth requirements.
Gain Meaningful Insights & Shorten Time-to-Resolution
Citrix Analytics for Performance is the ideal enhancement to gain insights, shorten time-to-resolution (TTR) with meaningful insights. Custom reports will help you to compare how you improved the User Experience week over week and month over month.
Take action yourself, logon to citrix.cloud.com or register an account at no cost.
Request a free Citrix Analytics for Performance trial and connect your existing Citrix Virtual Apps & Desktops environment and your Citrix DaaS environment.
Take a closer look at the Tech Zone PoC Guide for Citrix Analytics and making sure all firewall permissions and version requirements are in place. You will be able to connect your On-Premises Citrix environment in less than 90 minutes, following this guide – without the need to install any agents!

Disclaimer: The development, release and timing of any features or functionality described for our products remains at our sole discretion and are subject to change without notice or consultation. The information provided is for informational purposes only and is not a commitment, promise or legal obligation to deliver any material, code or functionality and should not be relied upon in making purchasing decisions or incorporated into any contract.