For a long time if you asked many experts in the field how long it takes for a Provisioning Services (PVS) server to failover, many would have cited an old case study where it took 8 minutes to failover approximately 1500 VMs. This was quite long ago and much has changed over the years so we wanted to see if failover time still plays a part in PVS server sizing. In this post, I’ll be sharing lessons learned from recent testing that shows scaling out PVS servers because of high failover time is a thing of the past. I will be covering all this assuming you have an understanding of PVS, if not you can check out the eDocs and the Virtual Desktop Handbook to read up.
In order to test failover times, an environment with 1000 Windows 8.1 x64 target devices running the PVS 7.1 target software was used. In accordance with Citrix best practices, the Windows 8.1 image was optimized as per CTX140375. Environment details are summarized at the end of the post.
Test Methodology
There were three scenarios run to determine failover time. These tests were run first to determine failover time as a factor of the number of target devices and then as a factor of registry changes as specified in CTX119223. The three scenarios are listed below:
- 500 target device failover with default settings
- 1000 target device failover with default settings
- 1000 target device failover with registry changes
Before I provide the results, let’s review how to actually measure the failover time or simulate a failover. I needed a consistent way of measuring the failover time, or more importantly, the time in which the desktop is unresponsive to a user. To do this, I ran the through the following test process:
- All target machines were booted up from a single PVS server.
- A second PVS server was brought online, but was not streaming to any target devices.
- All target devices were loaded with a simulated workload using LoginVSI 4.0 in order to mirror actual usage. The “light” workload was used in order to test a higher volume of targets although the type of workload should not affect the failover time.
- After all devices were continually running the workload, a script was run for each target to continually write the time to a remote file. This acted as the failover timer.
- The network card used to stream the target devices on the first PVS server was disabled. This caused an ungraceful failover as opposed to a graceful failover caused by disabling the streaming service through the console
- During the failover, targets that became unresponsive temporarily stopped writing the time to the remote file. Once they failed over to the second PVS server, they continued writing the time. The length of this stoppage was marked as the failover time for that target device.
Note: Stopping the streaming service through the PVS console causes a graceful failover and does not simulate a failure scenario. This is a product feature and a good thing if you need to perform maintenance, but not if you want to test an unplanned failover J.
Results
Now using this methodology, what sort of failover times did we get? The maximum failover time for each scenario is as follows:
- 500 target device failover with default settings = 76 Seconds
- 1000 target device failover with default settings = 76 Seconds
- 1000 target device failover with registry changes = 35 Seconds
That is definitely not 8 minutes, and these were the maximum times recorded. Many sessions never became unresponsive due to the use of the Windows standby cache used by the PVS target. If the target does not need to read anything from the vDisk during failover (as in everything is cached locally), the target never becomes unresponsive.
Key Takeaways:
- There was no change in failover time between 500 and 1000 targets. For this reason, failover time should not be the deciding factor in determining the number of PVS servers required to support an environment. Instead, the number of required PVS servers should be based on whether the number of target connections can be supported in the event that one PVS server fails. This means leveraging the N+1 rule for PVS server redundancy. For more design decisions regarding PVS see the Virtual Desktop Handbook.
- It is possible to modify the registry to change the failover behavior. Proceed with caution! Like the article mentions, changing these settings to very low values can result in constant failover being initiated due to any network disruption and is therefore not recommended. In this test, I modified two settings as noted in CTX119223. The first is to change the timeout value for a reply for each packet sent to the PVS server. I set this to 1 second, which is quite low. The second change I made was the number of retries before initiating failover. I changed this from the default of 10, to 4.
- If you must reduce the possible failover time because the default is too long, I suggest increasing the minimum timeout to 2 seconds to help reduce the risk of constant failover and reducing the number of retries to 4 instead of the default of 10.
The registry keys for this are changed under HKEY_LOCAL_MACHINE\SYSTEM\CurrentControlSet\Services\BNIStack\Parameters\:
IosPacketMinTimeoutms = 00002000
IosRetryLimit = 00000004
Environment Overview
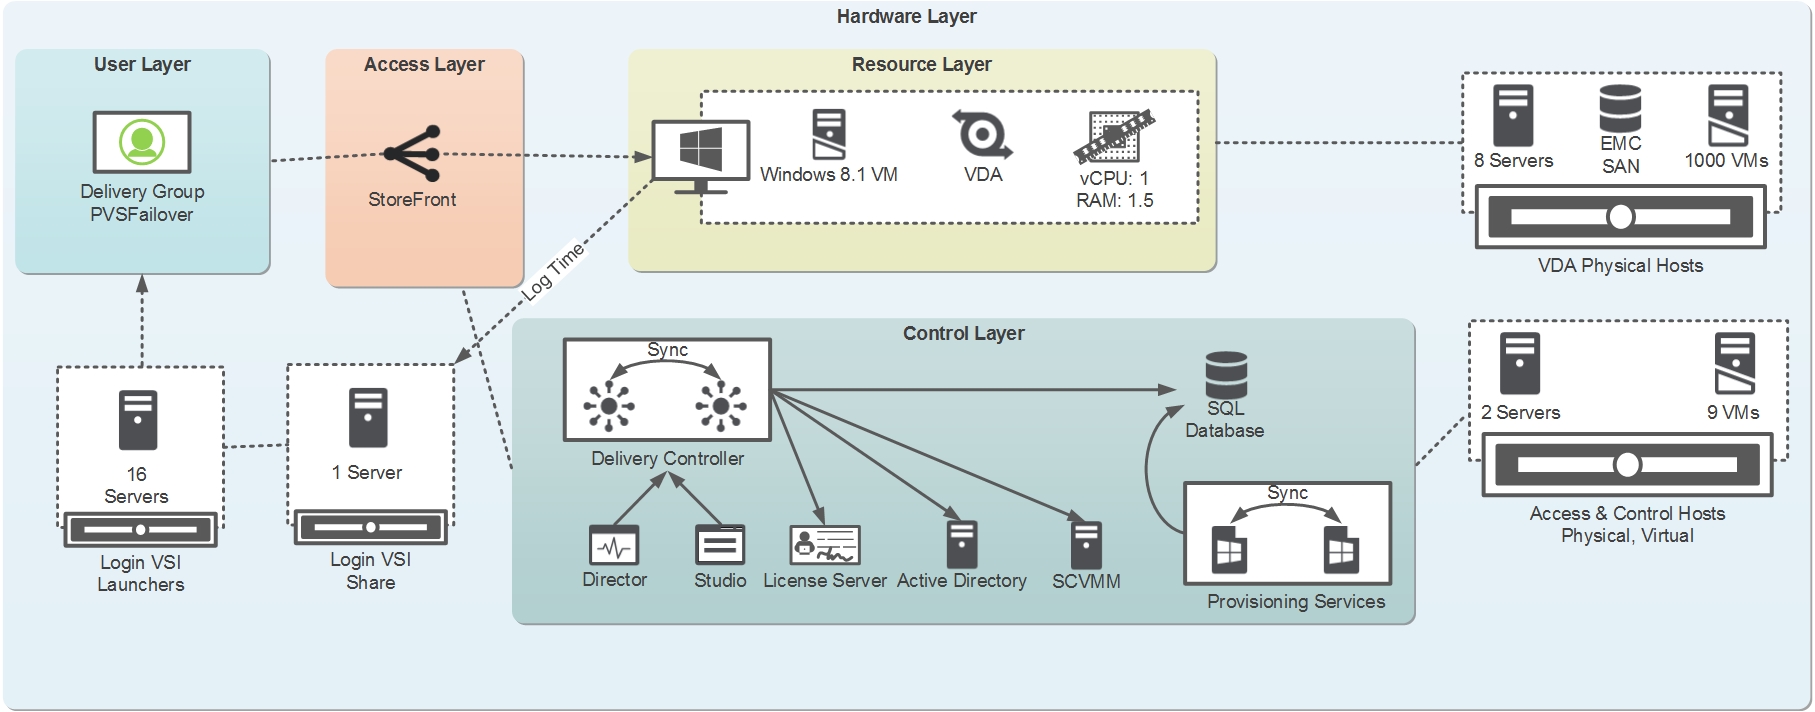
An 8 host cluster with 125 virtual machines on each host was used with the write cache drives residing on an EMC SAN presented to the hypervisor as a clustered shared volume (CSV). I also had a XenDesktop 7.1 deployment set up along with LoginVSI 4.0 to simulate some light user workload while running my tests. The environment details are summarized below along with an environment diagram. (Click the image to enlarge). Note that the tests were run with the Cache in Device Hard Drive write cache option as I ran these tests a little while back before the 1 IOPS bandwagon (see multiple recent blog posts on the new RAM Cache with overflow option). However, the write cache option should not affect the failover time.
| Server | HP ProLiant BL460c Gen8 |
| CPU | 16 Cores Intel Xeon @ 2.60 GHz |
| Memory | 192 GB |
| Storage | EMC VNX5500 Storage Array |
| Hypervisor | Hyper-V 3 on Server 2012 R2 |
| PVS Specs | 2 Servers at 4vCPU and 16GB vRAM |
Thank You
I’d like to give a big thanks to the team at the Citrix Solutions Lab for providing and supporting all of the hardware that made these tests possible and to thank EMC for providing the VNX array that was used as the primary storage appliance. I would also like to recognize Carl Fallis, Gregorz Iskra, Martin Zugec and Andy Baker for their various contributions and input on the testing.
Thanks for reading,
Amit Ben-Chanoch
Worldwide Consulting
Desktop & Apps Team
Project Accelerator
Virtual Desktop Handbook