NOTICE: Since WordPress is corrupting posted Powershell code, you can download all the Powershell samples here.
One of the common errors you can encounter during your XenDesktop deployment are VDAs that are stuck in Unregistered state – if you have a look at support forums, you can find quite a lot of questions about this issue.
There are different reasons why people write blog posts – sometimes you want to share new information, sometimes you just want to share information with fellow partners and customers and sometimes you use blog to summarize your ideas and make your life easier when you run into same problem in the future.
Our brains got limited capacity – at least mine does. I tend to forget the stuff that I don’t consider important, especially if I know I can easily Google it if needed. In this case, I’ve decided to write this article to store everything related to Brokering troubleshooting in one place, so when I will get stuck next time, I know where to look for the right answer! J
Registration process is communication between controller (DDC) and worker (VDA), where VDA needs to register with particular DDC to become available for the end users.
You want to minimize the interferences here –what I usually do is that I create 1:1 relationship – VDA is pointing only to single DDC and DDC is communicated only with this single VDA. Also, I tend to place both VMs (in case DDC is virtualized) on a single hypervisor host and use the same VLAN.
There is very simple method how you can force the registration process – all you have to do is to restart process “Citrix Desktop Service” (VDA). Using this method, you can easily confirm all your changes.
Most common problems
1.) Firewall configuration
This doesn’t mean only built-in Windows firewall, but any firewall on the way. The easiest method to validate this is to telnet to port 80 (8080 if you are using XenDesktop 4) – VDA -> DDC and DDC -> VDA.
2.) DNS not properly configured
Very common problem – you need not only forward, but also reverse DNS lookups to work properly. Perform the Ping and compare it against ipconfig – and afterwards try nslookup queries. You can also try to execute the .NET code to avoid any additional logic added by nslookup:
<!-- Code highlighting produced by Actipro SyntaxEditor http://www.ActiproSoftware.com/Products/DotNet/ --><span style="color: #000000">[</span><span style="color: #008080">System.Net.Dns</span><span style="color: #000000">]::</span><span style="color: #8b4513">GetHostEntry</span><span style="color: #000000">(<IP Address>).</span><span style="color: #8b4513">HostName</span>
3.) Time synchronization not properly configured
Since Kerberos is being used, time synchronization is very important (default Kerberos setting is maximum 5 minutes difference). W32tm is the key utility here or you can use Powershell:
<!-- Code highlighting produced by Actipro SyntaxEditor http://www.ActiproSoftware.com/Products/DotNet/ --><span style="color: #800080">$LocalTime</span><span style="color: #ff0000">=</span><span style="color: #000000"> ([</span><span style="color: #008080">wmi</span><span style="color: #000000">]</span><span style="color: #800000">''</span><span style="color: #000000">).ConvertToDateTime((</span><span style="color: #5f9ea0;font-weight: bold">Get-WmiObject</span><span style="color: #5f9ea0;font-style: italic">-Query</span><span style="color: #800000">"</span><span style="color: #800000">select LocalDateTime from win32_OperatingSystem</span><span style="color: #800000">"</span><span style="color: #000000">).LocalDateTime)</span>
The beauty of this method is that you will get an instance of [DateTime] object – and guess what, you can very easily compare two [DateTime] objects to get [TimeSpan] object:
PS C:\> $RemoteTime – $LocalTime
Days : 0
Hours : 0
Minutes : 1
Seconds : 17
Milliseconds : 182
Ticks : 771820000
TotalDays : 0.000893310185185185
TotalHours : 0.0214394444444444
TotalMinutes : 1.28636666666667
TotalSeconds : 77.182
TotalMilliseconds : 77182
Long story short – following code should show you the time drift between two servers:
<!-- Code highlighting produced by Actipro SyntaxEditor http://www.ActiproSoftware.com/Products/DotNet/ --><span style="color: #800080">$Server1</span><span style="color: #ff0000">=</span><span style="color: #800000">"</span><span style="color: #800000">.</span><span style="color: #800000">"</span><span style="color: #000000">; </span><span style="color: #800080">$Server2</span><span style="color: #ff0000">=</span><span style="color: #800000">"</span><span style="color: #800000"><SpecifyServerName></span><span style="color: #800000">"</span><span style="color: #000000">; [</span><span style="color: #008080">datetime</span><span style="color: #000000">]</span><span style="color: #800080">$Server1DT</span><span style="color: #ff0000">=</span><span style="color: #000000"> $(([</span><span style="color: #008080">wmi</span><span style="color: #000000">]</span><span style="color: #800000">''</span><span style="color: #000000">).ConvertToDateTime((</span><span style="color: #5f9ea0;font-weight: bold">Get-WmiObject</span><span style="color: #5f9ea0;font-style: italic">–Computer</span><span style="color: #800080">$Server1</span><span style="color: #5f9ea0;font-style: italic">-Query</span><span style="color: #800000">"</span><span style="color: #800000">select LocalDateTime from in32_OperatingSystem</span><span style="color: #800000">"</span><span style="color: #000000">).LocalDateTime) [</span><span style="color: #008080">datetime</span><span style="color: #000000">]</span><span style="color: #800080">$Server2DT</span><span style="color: #ff0000">=</span><span style="color: #000000"> ([</span><span style="color: #008080">wmi</span><span style="color: #000000">]</span><span style="color: #800000">''</span><span style="color: #000000">).ConvertToDateTime((</span><span style="color: #5f9ea0;font-weight: bold">Get-WmiObject</span><span style="color: #5f9ea0;font-style: italic">–Computer</span><span style="color: #800080">$Server2</span><span style="color: #5f9ea0;font-style: italic">-Query</span><span style="color: #800000">"</span><span style="color: #800000">select LocalDateTime from win32_OperatingSystem</span><span style="color: #800000">"</span><span style="color: #000000">).LocalDateTime)) $(</span><span style="color: #800080">$Server1DT</span><span style="color: #ff0000">-</span><span style="color: #800080">$Server2DT</span><span style="color: #000000">).TotalSeconds </span>
The code is quick and dirty – this is something I usually construct in interactive console, I just wanted to share the idea with you. The result is the time difference between two servers (in seconds). Be aware that this can be both positive and negative number – just focus on the total number.
4.) Domain membership problems
Sometimes there could be a problem with domain membership – I’ve never seen this before, so it’s just added to my list to be complete.
5.) Multiple Network Adapters
Again, I’ve never experienced this (I usually use only single NIC for VDAs) – multiple NICs can cause negotiation to fail.
6.) Service Principal Names (SPNs)
SPNs are very important during VDA registration process – you could run into multiple issues with SPNs. Controller will have a look at AD object of the VDA and automatically determine SPN by inspecting servicePrincipalName attribute.
There is quite simple method how to check SPN registrations – just execute following commands:
SetSPN –L <VDA> and SetSPN –L <DDC>
For both computers, you should see 2 entries – one should be “HOST/ComputerName” and the second one should be “HOST/FQDN”.
You should also perform SetSPN –X command – this command will show you all duplicate SPN records.
7.) Proper DDC not found
This is actually quite common mistake, even though I haven’t seen it myself (I usually use machine Group Policy Preferences to configure list of DDCs and I use CNAMEs to simplify management). Check your event log (on VDA) for event 1010 – this event should contain all known controller names – and confirm that all entries are valid. Use following keys to define your controllers:
HKLM\Software\Citrix\VirtualDesktopAgent\ListOfDDCs (32bit VM)
HKLM\Software\Wow6432Node\Citrix\VirtualDesktopAgent\ListOfDDCs (64bit VM)
DDCs are defined as strings (FQDN) with spaces to separate them.
8.) “Access this computer from the network” rights
By default, this should work, but if your environment is more secured, you can run into an issue when controller is not able to access VDA. This behavior is described in CTX117449.
9.) Operation timing out
XenDesktop brokering is based on Windows Communication Foundation – WCF is technology that is part of .NET Framework (introduced in .NET Framework 3.0). It’s not purpose of this article to explain the internals of WCF, but you need to know one information – WCF is using channels and activities and these activities (defined by “begin” and “end” boundaries). These activities can have timeouts defined – for example openTimeout (how long you are willing to wait when you open the connection), closeTimeout (how long it should take to dispose the client proxy) and probably the most important timeouts, SendTimeout and ReceiveTimeout.
What can happen (and it happens) is that your operation can time out – you send a message to the client, but don’t receive in the answer in the allocated time (timespan – for example for testing communication channel, this is by default 00:00:05). The exception details should say following:
Unhandled Exception: System.TimeoutException: The open operation did not complete within the allotted timeout of 00:00:05. The time allotted to this operation may have been a portion of a longer timeout.
What happens quite often is that your registration process would succeed – but it would need to get more time to do so. I’ve recently seen a scenario when server registration takes 4-6 seconds – so operation will timeout 2-3 times (>5 seconds) and then it will succeed (<5 seconds).
One solution of course would be the increase the timeout – but this is actually just workaround and you shouldn’t use it. This issue usually means something is wrong with your network – try to grab a wireshark trace to check what’s happening. Most important part of troubleshooting here is to check the WCF traces to see when message was sent and when it was received (more about this later on).
10.) MTU fragmentation
I’ve seen this behavior few times – MTU size is not the default 1500, therefore packet needs to be fragmented and they are marked with DF flag (do not fragment, drop the packet instead).
I created small script that can automatically check this value and display it:
Function GetMaxMTU {
Param (
[string]$Address= $(Throw“Argument -Address is required“),
[int]$MTU=1472
)
[boolean]$PingOK=$False
[int]$Step=1
Do {
$PingOutput= Ping -n 1 -l $MTU-f$Address
If ($PingOutput-like“*Sent = 1, Received = 1*“) {
Write-Host-ForegroundColorGreen“MTU size $MTU doesn’t need to be fragmented“
$PingOK=$True
} Else {
Write-Host“MTU $MTU is too high (or target is unreachable, increasing MTU size“
$MTU=$MTU–$Step
}
} Until ($PingOK-eq$True)
}
As you can see, I am using Ping with -l <MTUSize> and -f (DF flag) arguments. Be aware that the value that you should get is 1472 (1500 – 28 for header). If you get anything below this value, that means something is not right and you’re probably experiencing an issue with black hole router.
If you’re using hypervisor, you might consider removing temporarily any virtual router that you are using.
10.) Telnet connection
You should be able to telnet from controller to worker (port 80) and also from worker to controller (also port 80).
Basic troubleshooting
When you start with troubleshooting, there are two simple methods you can use (to start with). First one is amazing tool called XDPing from our support – you can download it here.
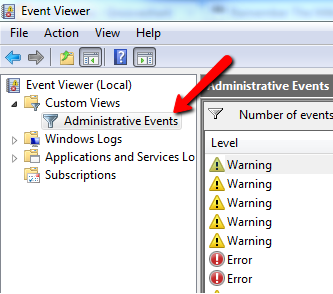
Another very important source of information (as usual) is your event log. During initial troubleshooting, I always prefer to use “Administrative Events” custom view – this view will show you only Critical, Error and Warning type of messages, so you can quickly see what’s wrong:
Intermediate troubleshooting
In case the very basic troubleshooting methods (XDPing and event log entries) doesn’t reveal anything. The next step is to enable logging for both controller (Broker service) and VDA (Workstation).
Since XenDesktop is based on .NET Framework, you need to modify the .config files to enable logging. This is described in knowledge based article CTX127492 – you need to enable it for Broker Service (DDC) and Workstation Agent (VDA).
It is important to keep in mind that brokering is multi-threaded – that means that in the log file, you can see log entries from multiple threads. Some knowledge about the Brokering workflow is needed here (HINT: Citrix Consulting knows a LOT about brokeringJ). For a start, I usually use this very simple script to check the execution times:
<!-- Code highlighting produced by Actipro SyntaxEditor http://www.ActiproSoftware.com/Products/DotNet/ --><span style="color: #0000ff">Param</span><span style="color: #000000"> ( [</span><span style="color: #008080">string</span><span style="color: #000000">]</span><span style="color: #800080">$LogFile</span><span style="color: #000000">, [</span><span style="color: #008080">string</span><span style="color: #000000">]</span><span style="color: #800080">$Filter</span><span style="color: #ff0000">=</span><span style="color: #800000">"</span><span style="color: #800000">*</span><span style="color: #800000">"</span><span style="color: #000000">, [</span><span style="color: #008080">timespan</span><span style="color: #000000">]</span><span style="color: #800080">$Threshold</span><span style="color: #ff0000">=</span><span style="color: #800000">"</span><span style="color: #800000">00:00:01</span><span style="color: #800000">"</span><span style="color: #000000"> ) </span><span style="color: #800080">$LogContent</span><span style="color: #ff0000">=</span><span style="color: #5f9ea0;font-weight: bold">type</span><span style="color: #800080">$LogFile</span><span style="color: #000000"> | </span><span style="color: #5f9ea0;font-weight: bold">Where</span><span style="color: #000000"> {</span><span style="color: #800080">$_</span><span style="color: #ff0000">-like</span><span style="color: #800080">$Filter</span><span style="color: #000000">} [</span><span style="color: #008080">timespan</span><span style="color: #000000">]</span><span style="color: #800080">$StartTime</span><span style="color: #ff0000">=</span><span style="color: #800080">$LogContent</span><span style="color: #000000">[0].split()[1] [</span><span style="color: #008080">timespan</span><span style="color: #000000">]</span><span style="color: #800080">$EndTime</span><span style="color: #ff0000">=</span><span style="color: #800080">$LogContent</span><span style="color: #000000">[0].split()[1] [</span><span style="color: #008080">string</span><span style="color: #000000">]</span><span style="color: #800080">$LastLine</span><span style="color: #ff0000">=</span><span style="color: #800000">""</span><span style="color: #0000ff">ForEach</span><span style="color: #000000"> (</span><span style="color: #800080">$Line</span><span style="color: #0000ff">in</span><span style="color: #800080">$LogContent</span><span style="color: #000000">) { </span><span style="color: #0000ff">If</span><span style="color: #000000"> (</span><span style="color: #800080">$Line</span><span style="color: #000000">.Split()[1].Length </span><span style="color: #ff0000">-eq</span><span style="color: #000000">13</span><span style="color: #000000">) { </span><span style="color: #800080">$EndTime</span><span style="color: #ff0000">=</span><span style="color: #800080">$Line</span><span style="color: #000000">.split()[1] </span><span style="color: #0000ff">If</span><span style="color: #000000"> (</span><span style="color: #800080">$EndTime</span><span style="color: #ff0000">-</span><span style="color: #800080">$StartTime</span><span style="color: #ff0000">-ge</span><span style="color: #800080">$Threshold</span><span style="color: #000000">) { </span><span style="color: #5f9ea0;font-weight: bold">Write-Host</span><span style="color: #5f9ea0;font-style: italic">-NoNewLine</span><span style="color: #000000"> $((</span><span style="color: #800080">$EndTime</span><span style="color: #ff0000">-</span><span style="color: #800080">$StartTime</span><span style="color: #000000">).TotalSeconds) </span><span style="color: #5f9ea0;font-weight: bold">Write-Host</span><span style="color: #800000">"</span><span style="color: #800000">: $LastLine</span><span style="color: #800000">"</span><span style="color: #000000"> } </span><span style="color: #800080">$StartTime</span><span style="color: #ff0000">=</span><span style="color: #800080">$EndTime</span><span style="color: #000000"> </span><span style="color: #800080">$LastLine</span><span style="color: #ff0000">=</span><span style="color: #800080">$Line</span><span style="color: #000000">.Remove(</span><span style="color: #000000">0</span><span style="color: #000000">,</span><span style="color: #000000">25</span><span style="color: #000000">) } } </span>In the output, you can see all the operations that took more than 1 second (-Threshold argument). I usually keep one example registration log somewhere if I needed to confirm that the timing is correct. As mentioned before, this method is not 100% reliable, since messages can come from different threads, but it is quick method how to have a look at what takes so long.
Expert troubleshooting
Now things are getting more interesting – we are finally getting to the expert troubleshooting.
If you know a lot about XenDesktop and WCF, you can skip the basic and immediate troubleshooting steps and just right to the expert troubleshooting – but this one requires a lot of skills – you’ve been warned! J
Since brokering is based on WCF (and WCF is subset .NET framework), you can actually use some tools that are used for .NET troubleshooting. In this case, we are going to use “Microsoft Service Trace Viewer” (SvcTraceViewer.exe) from Microsoft, nice and easy to use GUI for troubleshooting applications that are based on WCF.
SvcTraceViewer is part of Windows SDK, so you need to download the full SDK (as far as I know).
As a next step, we need to enable tracing for both DDC and VDA – again, we will use the same .exe.config files as before (Broker and Workstation). Simply add following lines under <configuration /> element (root) and restart the respective services:
   <system.diagnostics>
      <sources>
            <source name="System.ServiceModel"
                    switchValue="Information, ActivityTracing"
                    propagateActivity="true">
            <listeners>
               <add name="traceListener"
                   type="System.Diagnostics.XmlWriterTraceListener"
                   initializeData= "c:\XDlogs\Traces.svclog" />
            </listeners>
         </source>
      </sources>
   </system.diagnostics>
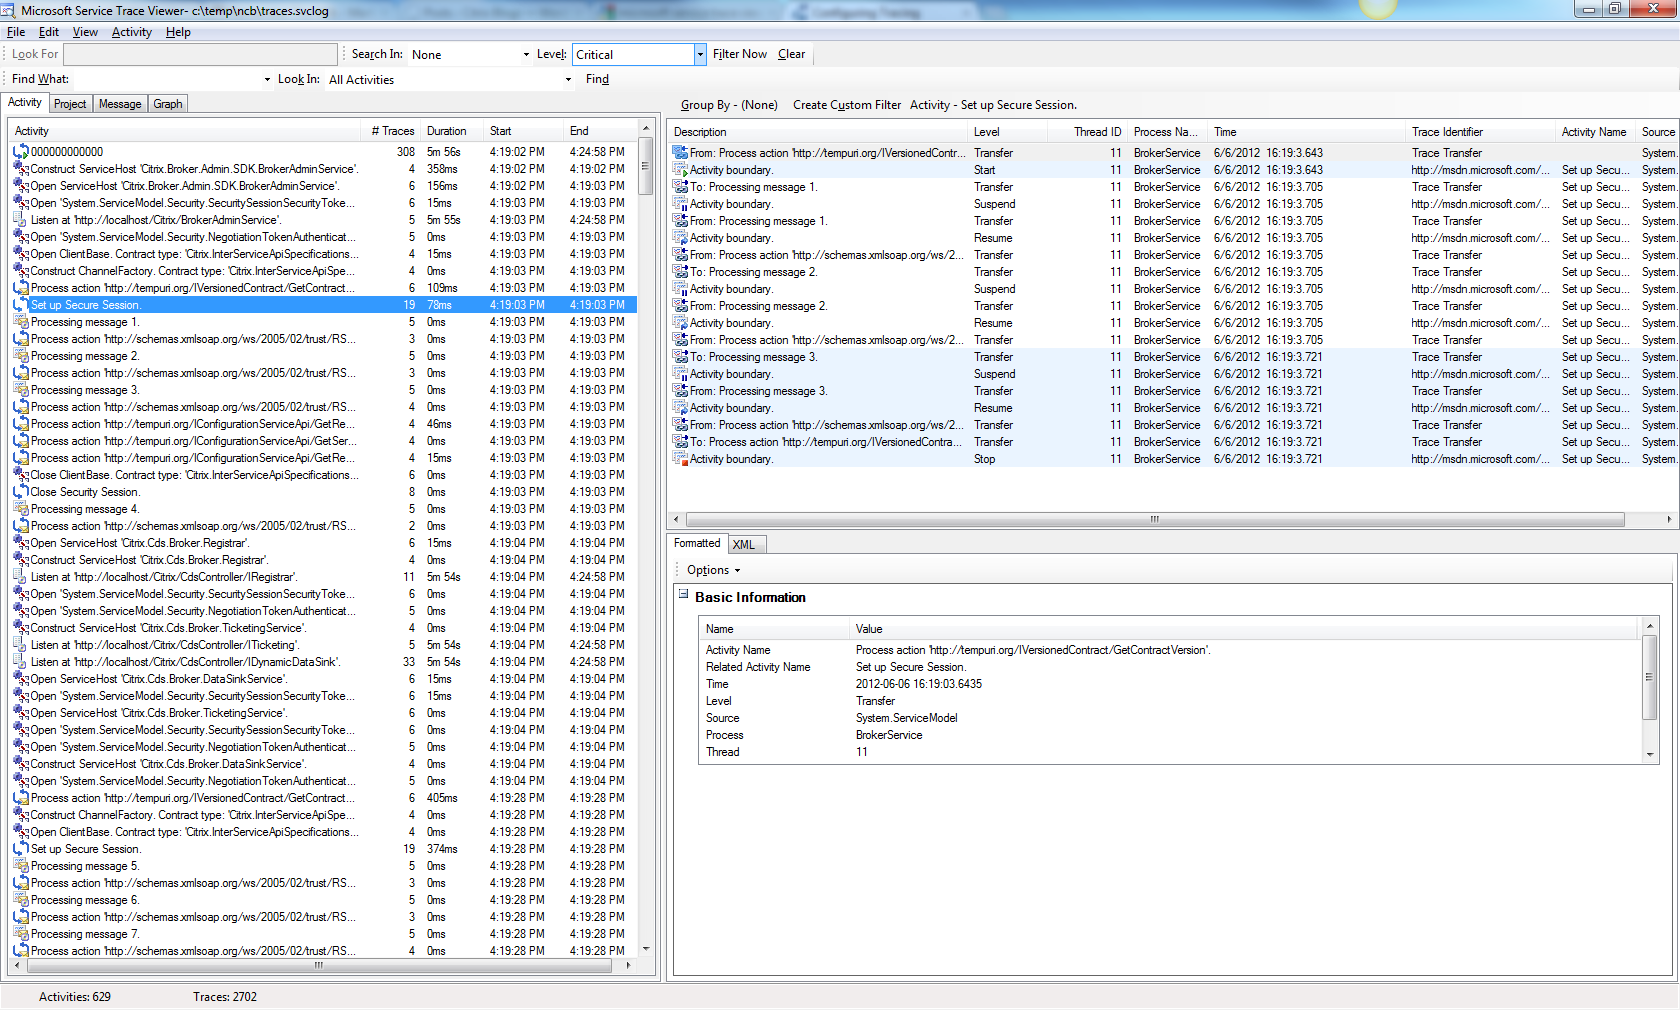
As a result, file Traces.svclog is automatically created in subfolder C:\XDLogs (feel free to change it). Now when you open this log file, you can see following:
Looks scary, but it’s not as complicated as it appears. On the right side, you can see activities together with their names, number of traces, duration and start\end times.
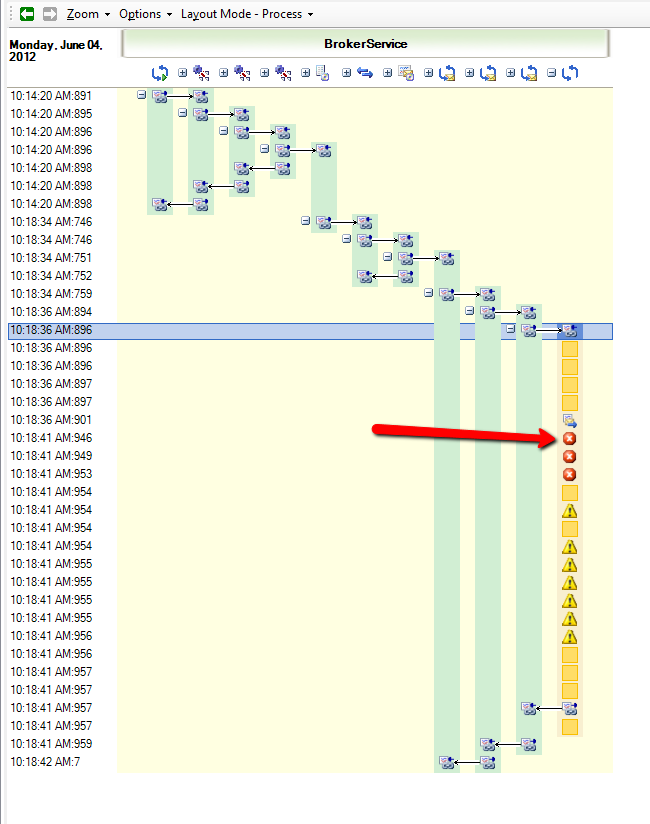
Errors and failed activities are highlighted in red, as you can see below, so it’s quite easy to spot them:
In this case, I can already guess that the issue is caused by timeout (duration – 5 seconds, default timeout to establish secure session).
Reading this is pretty possible, but not as easy to navigate – what we do next is that we click on failed activity (“Set up Secure Session.” in this case) and press “F4” key.
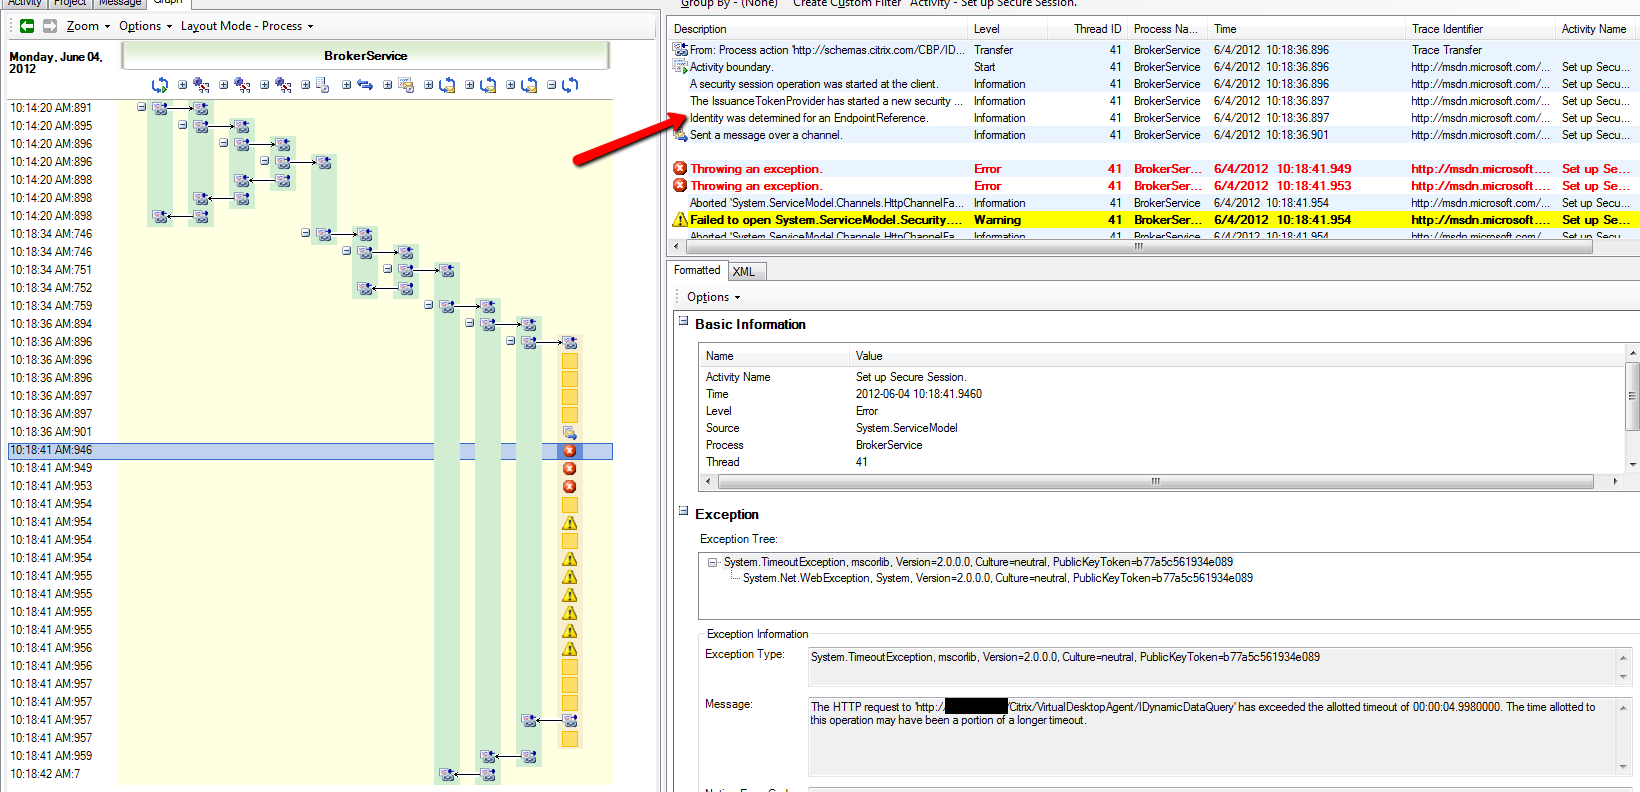
F4 will automatically switch to graph view, where it is much easier to see what’s happening, when and why it fails.
Usually, the error message you see is just notification about timeout, so all you need to do is to select the step that was performed before. Very important for registration is endpoint identity – all you need to do to identify it is to select the step “Identity was determined for an EndpointReference.”:
You should see the entry specifying which SPN name is being used and which IP address.
Another more advanced method is to use network traces (my favorite tool is still WireShark). Here, my recommendation is to grab 3 different traces:
1.) Windows <-> Windows
2.) VIF <-> VIF (Virtual NIC)
3.) PIF <-> PIF (Physical NIC)
You can skip the second step most of the time. If you compare the trace from Windows with the trace from PIF, you can detect if your hypervisor could be causing the issues (networking stack) or if it is really something out of your reach and you need to assign the helpdesk ticket to networking\Active Directory team instead.
Martin Zugec


